Figure 3
Download original image
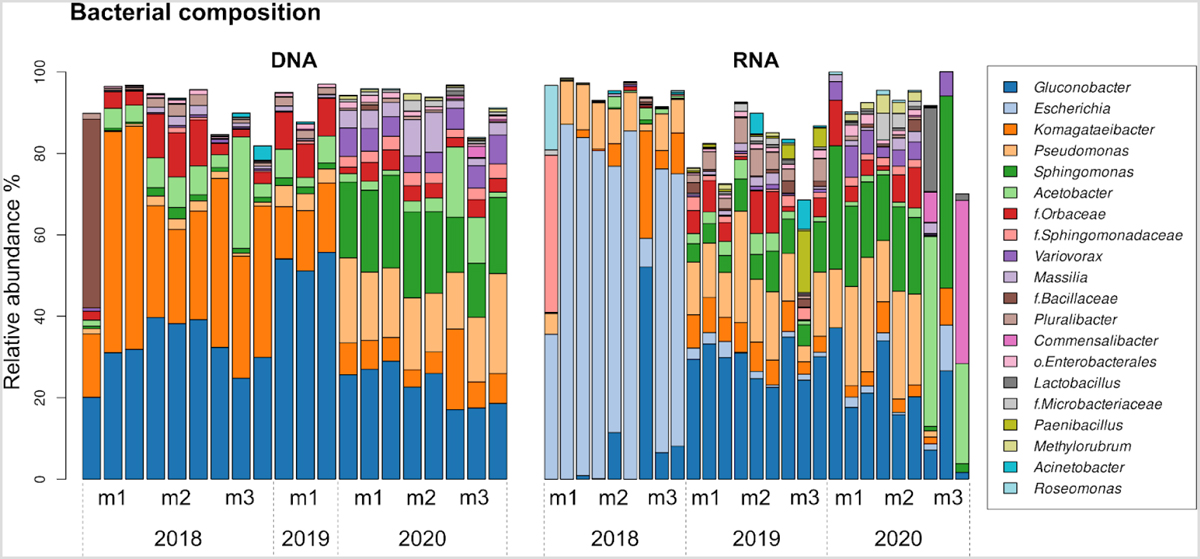
Bacterial composition and activity profile. Only genera that accounted for at least 1% on average across all samples or exceeded 5% in individual samples were included in the visualisation. Twenty genera collectively formed more than 69% of the entire composition and activity. Abbreviations o. and f. are for taxa that were classified only to the rank of order and family. Data shown for single biological replicate from each year.
Current usage metrics show cumulative count of Article Views (full-text article views including HTML views, PDF and ePub downloads, according to the available data) and Abstracts Views on Vision4Press platform.
Data correspond to usage on the plateform after 2015. The current usage metrics is available 48-96 hours after online publication and is updated daily on week days.
Initial download of the metrics may take a while.