| Issue |
BIO Web Conf.
Volume 68, 2023
44th World Congress of Vine and Wine
|
|
|---|---|---|
| Article Number | 04001 | |
| Number of page(s) | 11 | |
| Section | Health | |
| DOI | https://doi.org/10.1051/bioconf/20236804001 | |
| Published online | 23 November 2023 | |
The intelligent use of ethanol for direct determination of methanol in wines
1 Institute for Nuclear Problems of Belarusian State University, 220030, Bobruyskaya Str., 11, Minsk, Belarus
2 Belarussian State University, Nezavisimosti Av., 4, 220030, Minsk, Belarus
3 Peoples' Friendship University of Russia, 117198, Miklukho-Maklaya Str., 6, Moscow, Russia
Abstract
The results of experimental studies of the method based on the usage of ethyl alcohol as an internal standard for the direct determination of methyl alcohol in wines are presented. The method was validated in terms of precision, accuracy, limits of detection and quantification (LOD and LOQ), linearity, and robustness. The results, obtained for the developed method, were compared with the results, obtained for the official internal standard method OIV-MA-AS312-03A, using 4-methylpentan-2-ol as an internal standard. The within- and between-day precision (RSD) values of concentrations were in the ranges of 0.1-1.6% and 0.4-2.1% for the developed and official methods, correspondingly. The recovery values of concentrations were in the ranges of 99.4-101.7% and 99.4-102.3% for the developed and official methods, correspondingly. The linearity parameters R2 were 0.99996 and 0.99995 for the developed and official methods, correspondingly, as well as the LODs were 0.46 mg/L and 0.65 mg/L, the LOQs were 1.39 mg/L and 1.96 mg/L for mentioned methods. 36 samples of red, white and pink wines with different sugar levels (dry, semi-dry, semi-sweet and sweet) were studied by both developed and official methods. The relative difference between results obtained for both methods didn’t exceed ±1.5%.
© The Authors, published by EDP Sciences, 2023
 This is an Open Access article distributed under the terms of the Creative Commons Attribution License 4.0, which permits unrestricted use, distribution, and reproduction in any medium, provided the original work is properly cited.
1 Introduction
The methanol is one of the most toxic congeners of alcoholic beverages. It produced before and during alcoholic fermentation from the hydrolysis of pectins which are naturally present in the fruits [1]. The maximum content limits of the methanol are set as 400 mg/L for red wines and 250 mg/L for white wines and rosés [2]. There are two official OIV methods for the determination of methanol in wine: gas chromatographic [3] and spectrophotometric [4]. A gas chromatography flame ionization detector (GC-FID) method is applicable for the determination of methanol in wine for concentration range from 50 to 500 mg/L [3]. This method is based on the internal standard method. The use of the internal standard method makes it possible to overcome the influence of the instability of the chromatographic system and the matrix effect. However, the addition of an internal standard substance leads to the changes in the original sample. Also, this procedure requires material, labor and time costs associated with the need for manual sample preparation, additional calculations and contamination of the analyzed sample.
The developed GC-FID method is based on the use of ethanol as an internal standard, avoids the aforementioned disadvantages of the traditional internal standard method. There is no need to add any internal standard to the analysed sample, since ethyl alcohol is an essential component of any alcoholic beverage. This method was studied and validated for the determination of methanol in spirit drinks [5,6].
The aim of this study was to validate the proposed method and compare it with the official GC-FID method of analysis [4] in terms of precision, accuracy, limits of detection and quantification (LOD and LOQ), linearity, and robustness. The developed method was tested on 36 samples of wine.
2 Materials and methods
2.1 Reagents and wine samples
All standards at ≥99 % purity methanol (CAS 67-56-1), 4-methylpentan-2-ol (CAS 108-11-2) and ethanol (CAS 64-17-5) were purchased from Sigma-Aldrich (Madrid, Spain). The wine samples were purchased from local markets.
2.2 Preparation of standard solutions
Water-ethanol solution (WES) with ethanol concentration 10% ABV (absolute by volume) was prepared according to the procedure, described in the item 3.8.1 of OIV-MA-AS312-03A [3]. Standard solutions (SS) with methanol concentration 50; 100; 150; 200; 250 and 500 mg/L were prepared according to the procedure, described in the items 3.8.2-3.8.5 of OIV-MA-AS312-03A [3]. Standard solution with methanol concentration 5 mg/L was prepared by diluting of 50 mg/L methanol SS with WES for LOQ and LOD determination. 4-methylpentan-2-ol was used as internal standard for the official method [3], and ethanol was used as internal standard for the developed method.
2.3 Preparation of wine samples
The 36 wine samples were distillate according to the item 3 of OIV-MA-AS312-01A [7]. The real alcoholic strength by volume of purchased samples was determined according to the item 4 of OIV-MA-AS312-01A [7] by Method A (pycnometry). Internal standard (4-methylpentan-2-ol) was added to the obtained distillates according to the item 5.1 of OIV-MA-AS312-03A [3].
Strength by volume of red wine samples.
Strength by volume of white wine samples.
Strength by volume of pink wine samples.
2.4 Instrumentation
A gas chromatograph model Crystal-5000.1, coupled with a flame ionization detector (Chromatec, Yoshkar-Ola, Mari El) was used for the chromatographic analyses. The separation was performed with a capillary column Rt-Wax, 60 m × 0.53 mm I.D. × 1.0 μm film thickness (Restek, Bellefonte, USA). The injector and detector temperatures were 200 °C and 280 °C, correspondingly. The GC oven was set as followed: 70 °C (11 min hold), and finally ramped to 190 °C at 30 °C/min (10 min hold). Nitrogen was used as the carrier gas and the injection was a splitless mode. The split ratio was 10:1, the injection volume was 1.0 μL. Data acquisition and processing were controlled by UniChrom software (New Analytical Systems Ltd, Minsk, Belarus).
The example of obtained chromatograms of six prepared standard solutions in logarithmic scale is shown in Fig. 1.
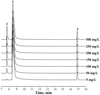 |
Figure 1 Chromatograms of the prepared standard solutions with the corresponding methanol concentrations. 1 – methanol; 2 – ethanol; 3 – 4-methylpentan-2-ol. |
3 Calculations
3.1 Calibration
3.1.1 OIV method
In case with the official method the calibration curve should be plotted for the concentration range from 50 to 500 mg/L.
The results of plotting of the calibration curve obtained for the official method are shown in Fig. 2.
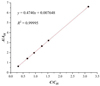 |
Figure 2 The calibration curve obtained for the official OIV method. |
3.1.2 Developed method
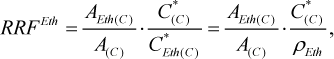
In case with the developed method the calibration was carried out by one-point calibration. The calibration solution was 10% water-ethanol solution with methanol concentration 250 mg/L. The calibration coefficient – relative response factor for methanol was calculated according to the formula
 (1)
(1)
where A(C) is the detector response to the methanol, obtained during measurement of solution, used for calibration, arbitrary units; AEth(C) is the detector response to the ethanol, obtained during measurement of solution, used for calibration, arbitrary units; C*Eth(C) and C*(C) are the concentrations of the ethanol and methanol in solution, used for calibration, correspondingly, mg/100 mL of anhydrous alcohol (AA); ρEth is the density of anhydrous ethanol, ρEth = 78927 mg/100 mL.
The obtained value of RRFEth = 1.298.
3.2 Determination of concentration
3.2.1 OIV method
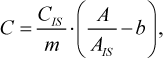
The concentration of methanol (in mg/L) was calculated according to the following equation
 (2)
(2)
where A and AIS are the detector responses to methanol and 4-methylpentan-2-ol, correspondingly, arbitrary units; CIS is the concentration of 4-methylpentan-2-ol, mg/L; m is the slope of calibration curve, m = 0.4740; b is the y-intercept of calibration curve, b = 0.00765.
The concentration of methanol (in mg/L AA) was calculated according to the following equation
 (3)
(3)
where P is the real strength of sample, % ABV.
3.2.2 Developed method
The concentration of methanol (in mg/100 mL AA) was calculated according to the following equation
 (4)
(4)
where AEth is the detector response to ethanol, arbitrary units; ρEth is the density of anhydrous ethanol, ρEth = 78927 mg/100 mL.
3.3 Method validation
3.3.1 Linearity
The linearity for both methods was estimated by coefficient of determination R2. The linearity graph obtained for the developed method is shown in Fig. 3.
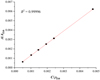 |
Figure 3 The linearity graph obtained for the developed method. |
3.3.2 Accuracy and precision
The precision of the method was evaluated in terms of repeatability (intraday) and intermediate precision (interday) according to the ICH guidelines [8]. The repeatability was evaluated as the relative standard deviation (RSD) of three injections of standard solutions and wines under repeatability conditions. The intermediate precision was evaluated as the RSD of nine injections of standard solutions (3 injections/3 days of study).
The accuracy of the method was evaluated in terms of recovery according to the ICH guidelines [8].
3.3.3 LOD and LOQ
The determination of LOD and LOQ was carried out according to the IUPAC Technical report [9] using following formulas
 (5)
(5)
 (6)
(6)
where s is the standard deviation of methanol concentration, obtained during 10 independent determinations at the lowest concentration level of methanol, mg/L.
3.3.4 Comparison of the results
The relative difference between the results, obtained for both official and developed method, was calculated according to the following formula
 (7)
(7)
where C*(Dev) and C*(OIV) are the concentrations of methanol in wine sample, obtained by the developed and official OIV methods, correspondingly, mg/100 mL AA.
The comparison of results was also performed for each wine sample at 0.05 significance level, employing MS Excel 2016 for the statistical Student’s test (t-Test: Paired Two Sample for Means) for the means comparison for obtained concentrations. As a null hypothesis the similarity between results, obtained for both developed and official methods was taken. As an alternative approach to the comparison ANOVA (Single factor) was used to confirm these results, considering the data normal distribution and employing 0.05 significance level. In the case with the Student’s test the critical t-value was tcr = 4.303. In the case with the ANOVA the critical F-value was Fcrit = 7.71.
4 Results and Discussion
The single-laboratory validation of the method was performed in terms of linearity, LOD, LOQ, repeatability intermediate precision and recovery.
Linearity was satisfactory (R2 > 0.999) for both methods, with a calculated R2 = 0.99995 in the case with official OIV method and R2 = 0.99996 in the case with the developed method for analytical range 50-500 mg/L of methanol concentrations.
In the case with the developed method the values of LOD and LOQ were 0.46 mg/L and 1.39 mg/L, correspondingly. In the case with the official method the values of LOD and LOQ were 0.46 mg/L and 1.39 mg/L, correspondingly.
The within- and between-day precision (RSD) values of concentrations were in the ranges of 0.1-1.6% and 0.4-2.1% for the developed and official methods, correspondingly. The recovery values of concentrations were in the ranges of 99.4–101.7% and 99.4–102.3% for the developed and official methods, correspondingly. The more detailed results of precision and accuracy study are presented in Tables 4 and 5.
The obtained chromatograms of wine samples in logarithmic scale are shown in Figs. 4-15.
The comparison of the results obtained for both official and developed showed that the relative difference between the values of concentrations is less than ± 1.5%.
Both statistical tests (Student’s and ANOVA) confirmed that the difference between the means, obtained for both methods for all the studied samples is statistically insignificant.
The results of study of wine samples and of the statistical analysis are presented in Tables 6-17
Results of precision (intraday) and accuracy study (n = 3).
Results of precision (interday) and accuracy study (n = 9).
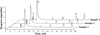 |
Figure 4 Chromatograms of the dry red wine samples. 1 – methanol; 2 – ethanol; 3 – 4-methylpentan-2-ol. |
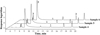 |
Figure 5 Chromatograms of the semi-dry red wine samples. 1 – methanol; 2 – ethanol; 3 – 4-methylpentan-2-ol. |
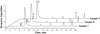 |
Figure 6 Chromatograms of the semi-sweet red wine samples. 1 – methanol; 2 – ethanol; 3 – 4-methylpentan-2-ol. |
 |
Figure 7 Chromatograms of the sweet red wine samples. 1 – methanol; 2 – ethanol; 3 – 4-methylpentan-2-ol. |
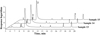 |
Figure 8 Chromatograms of the dry white wine samples. 1 – methanol; 2 – ethanol; 3 – 4-methylpentan-2-ol. |
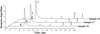 |
Figure 9 Chromatograms of the semi-dry white wine samples. 1 – methanol; 2 – ethanol; 3 – 4-methylpentan-2-ol. |
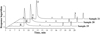 |
Figure 10 Chromatograms of the semi-sweet white wine samples. 1 – methanol; 2 – ethanol; 3 – 4-methylpentan-2-ol. |
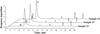 |
Figure 11 Chromatograms of the sweet white wine samples. 1 – methanol; 2 – ethanol; 3 – 4-methylpentan-2-ol. |
 |
Figure 12 Chromatograms of the dry pink wine samples. 1 – methanol; 2 – ethanol; 3 – 4-methylpentan-2-ol. |
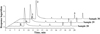 |
Figure 13 Chromatograms of the semi-dry pink wine samples. 1 – methanol; 2 – ethanol; 3 – 4-methylpentan-2-ol. |
 |
Figure 14 Chromatograms of the semi-sweet pink wine samples. 1 – methanol; 2 – ethanol; 3 – 4-methylpentan-2-ol. |
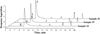 |
Figure 15 Chromatograms of the sweet pink wine samples. 1 – methanol; 2 – ethanol; 3 – 4-methylpentan-2-ol. |
Results of study of dry red wine by both developed and official OIV methods.
Results of study of semi-dry red wine by both developed and official OIV methods.
Results of study of semi-sweet red wine by both developed and official OIV methods.
Results of study of sweet red wine by both developed and official OIV methods.
Results of study of dry white wine by both developed and official OIV methods.
Results of study of semi-dry white wine by both developed and official OIV methods.
Results of study of semi-sweet white wine by both developed and official OIV methods.
Results of study of sweet white wine by both developed and official OIV methods.
Results of study of dry pink wine by both developed and official OIV methods.
Results of study of semi-dry pink wine by both developed and official OIV methods.
Results of study of semi-sweet pink wine by both developed and official OIV methods.
Results of study of sweet pink wine by both developed and official OIV methods.
5 Conclusions
A modified internal standard method for direct determination of methanol in wine was validated and compared with the official OIV method in terms of precision, accuracy, limits of detection and quantification (LOD and LOQ), linearity, and robustness. The developed method makes it possible to directly determine the concentration of methanol in wines without preliminary sample preparation (distillation and addition of an internal standard compound) and to reduce the minimum required amount of a sample for analysis to 1 mL.
High efficiency and wide international testing of the method using ethanol as an internal standard can serve as the basis for initiating, in the established manner, interlaboratory study under patronage of the International Organization of Vine and Wine (OIV) for the purpose of its subsequent approval as a standardized reference method on the international level.
Conflicts of interest
The authors declare no conflict of interest.
References
- G. Hodson, E. Wilkes, S. Azevedo, T. Battaglene, BIO Web of Conferences 9, 02028 (2017) [CrossRef] [EDP Sciences] [Google Scholar]
- OENO 19/2004 Maximum content limits of methanol in wines (2004) [Google Scholar]
- OIV-MA-AS312-03A Methanol (GC) (2014) [Google Scholar]
- OIV-MA-AS312-03B Methanol (colorimetry) (2009) [Google Scholar]
- S. Charapitsa, S. Sytova, A. Kavalenka, L. Sabalenka, M. Zayats, V. Egorov, S. Leschev, I. Melsitova, S. Vetokhin, N. Zayats, J. Food Compos. Anal. 114, 104772 (2022) [CrossRef] [Google Scholar]
- S. Charapitsa, S. Sytova, A. Kavalenka, L. Sobolenko, N. Kostyuk, V. Egorov, S. Leschev, S. Vetokhin, N. Zayats, Food Control 120, 107528 (2021) [CrossRef] [Google Scholar]
- OIV-MA-AS312-01A Alcoholic strength by volume (2016) [Google Scholar]
- ICH Validation of Analytical Procedures: Text and Methodology. International Conference on Harmonization (ICH), Q2(R1), Geneva (2005) [Google Scholar]
- M. Thompson, S. L. R. Ellison, R. Wood, Pure Appl. Chem. 74, 5 (2002) [Google Scholar]
All Tables
Results of study of semi-dry red wine by both developed and official OIV methods.
Results of study of semi-sweet red wine by both developed and official OIV methods.
Results of study of semi-dry white wine by both developed and official OIV methods.
Results of study of semi-sweet white wine by both developed and official OIV methods.
Results of study of sweet white wine by both developed and official OIV methods.
Results of study of semi-dry pink wine by both developed and official OIV methods.
Results of study of semi-sweet pink wine by both developed and official OIV methods.
All Figures
|
Figure 1 Chromatograms of the prepared standard solutions with the corresponding methanol concentrations. 1 – methanol; 2 – ethanol; 3 – 4-methylpentan-2-ol. |
| In the text | |
|
Figure 2 The calibration curve obtained for the official OIV method. |
| In the text | |
|
Figure 3 The linearity graph obtained for the developed method. |
| In the text | |
|
Figure 4 Chromatograms of the dry red wine samples. 1 – methanol; 2 – ethanol; 3 – 4-methylpentan-2-ol. |
| In the text | |
|
Figure 5 Chromatograms of the semi-dry red wine samples. 1 – methanol; 2 – ethanol; 3 – 4-methylpentan-2-ol. |
| In the text | |
|
Figure 6 Chromatograms of the semi-sweet red wine samples. 1 – methanol; 2 – ethanol; 3 – 4-methylpentan-2-ol. |
| In the text | |
|
Figure 7 Chromatograms of the sweet red wine samples. 1 – methanol; 2 – ethanol; 3 – 4-methylpentan-2-ol. |
| In the text | |
|
Figure 8 Chromatograms of the dry white wine samples. 1 – methanol; 2 – ethanol; 3 – 4-methylpentan-2-ol. |
| In the text | |
|
Figure 9 Chromatograms of the semi-dry white wine samples. 1 – methanol; 2 – ethanol; 3 – 4-methylpentan-2-ol. |
| In the text | |
|
Figure 10 Chromatograms of the semi-sweet white wine samples. 1 – methanol; 2 – ethanol; 3 – 4-methylpentan-2-ol. |
| In the text | |
|
Figure 11 Chromatograms of the sweet white wine samples. 1 – methanol; 2 – ethanol; 3 – 4-methylpentan-2-ol. |
| In the text | |
|
Figure 12 Chromatograms of the dry pink wine samples. 1 – methanol; 2 – ethanol; 3 – 4-methylpentan-2-ol. |
| In the text | |
|
Figure 13 Chromatograms of the semi-dry pink wine samples. 1 – methanol; 2 – ethanol; 3 – 4-methylpentan-2-ol. |
| In the text | |
|
Figure 14 Chromatograms of the semi-sweet pink wine samples. 1 – methanol; 2 – ethanol; 3 – 4-methylpentan-2-ol. |
| In the text | |
|
Figure 15 Chromatograms of the sweet pink wine samples. 1 – methanol; 2 – ethanol; 3 – 4-methylpentan-2-ol. |
| In the text | |
Current usage metrics show cumulative count of Article Views (full-text article views including HTML views, PDF and ePub downloads, according to the available data) and Abstracts Views on Vision4Press platform.
Data correspond to usage on the plateform after 2015. The current usage metrics is available 48-96 hours after online publication and is updated daily on week days.
Initial download of the metrics may take a while.