| Issue |
BIO Web Conf.
Volume 68, 2023
44th World Congress of Vine and Wine
|
|
|---|---|---|
| Article Number | 01020 | |
| Number of page(s) | 4 | |
| Section | Viticulture | |
| DOI | https://doi.org/10.1051/bioconf/20236801020 | |
| Published online | 06 December 2023 | |
Digital Holography and artificial intelligence for real-time detection and identification of pathogenic airborne spores
1 Dept. Applied Physics, Univ. Geneva, Rue de l’Ecole-De-Médecine 20, 1205 Genève 4, Switzerland
2 Mycology Group, Research Department Plant Protection, Agroscope Changins, Route de Duiller 50, 1260 Nyon, Switzerland
3 Château le Puy, 33570 Saint-Cibard, France
4 Inst. For Environmental Sciences, Univ. Geneva, Blvd Carl-Vogt 66, 1211 Genève 4, Switzerland
Abstract
Ever-growing concerns and governmental restrictions related to the use of pesticides in modern agriculture has driven the need for more adept decision-making tools to minimize unnecessary treatments whilst still efficiently preventing a spread of infection. To this effect, a network of cost-effective, laser-based holographic detectors were developed and placed in vineyards in Switzerland and France with the objective of detecting and identifying airborne spores of downy and powdery mildew before they have the potential to infect crops. The data collected are remotely sent to a server where image processing techniques and artificial intelligence classify the spores and determine the quantitative intervention thresholds. Knowledge on the quantitative development of fungal diseases has been successfully used to temporally and spatially identify the primary infection of downy mildew which was confirmed by a visual evaluation of symptoms within the parcel. This data coupled with the current risk prediction models provide farmers with a powerful decision-making tool to optimise strategies in the management of grapevine diseases.
© The Authors, published by EDP Sciences, 2023
 This is an Open Access article distributed under the terms of the Creative Commons Attribution License 4.0, which permits unrestricted use, distribution, and reproduction in any medium, provided the original work is properly cited.
1 Introduction
Environmentally friendly treatment plans and products, marker-assisted selection of resistant phenotypes and more precise decision-making technologies are some of the significant efforts developed to tackle governmental regulation strategies dedicated to the reduction of pesticides in agriculture. Their use impacts the soil, air, human health, and final product costs and quality [1]. In this study, we consider two major grapevine diseases; downy and powdery mildew caused by the oomycete Plasmopara viticola (PV) and the ascomycete Erysiphe necator (EN) respectively. These polycyclic pathogens are characterised by having a fast asexual cycle leading to the production, release, and dispersion of spores in the environment [2].
To treat the crops more selectively in time and space, efforts have been made in developing precise prediction models and smart sensing tools [3]. Typically, these are devices which detect the pathogens in the air using DNA, leaf sampling and further analyses in the laboratory, weather-based prediction models linked to the parasite’s biology, or hyperspectral imaging of the field using drones and satellites [3-5]. A key drawback to these techniques is related to the lack of simultaneously available spatially resolved data, with measurements taken quickly but not at the same time at various locations, and high temporal resolution, as the delay in getting selective results can range anywhere between a few days to a week. Additionally, predictive models based on meteorological data such as air temperature, humidity, precipitation, and wind values do not account for the local context. They lack the information related to the topography, proximity to forests or rivers, soil quality, turbulence, treatment history, etc, which dictate the appearance of sources and infection conditions as well as the dispersion of the spores [6]. Contrastingly, hyperspectral cameras installed on drones detect the symptoms of an already infected plant making them ineffective as prediction tools for the wine growers.
In a previous study, a network of autonomous stations providing real-time information on the concentration and size distribution of airborne particles demonstrated the spatial and temporal heterogeneity of spore concentrations within this same field [7]. However, the optical particle counters lacked the necessary selectivity to distinguish between the spore species, PV and EN as well as other particles in the same size range (10-30 µm). The validation was done by weekly-integrated impaction filters analysed in the laboratory by multimodal, multiphoton microscopy [8].
To address this issue, the stations presented here were upgraded to integrate a new technique using digital holography to obtain a high-resolution, three-dimensional image which allows for a greater specificity of airborne particles, validated by qPCR analyses and repeated fungicides applications over the season, depending on crop management and disease pressure [9]. Additionally, the use of an optical method with the automatic renewal of the impact surface and online transfer of the images enables a larger volumetric sampling size than direct imaging with a frequency of measurements on the hourly scale. This results in a large quantity of data for which an algorithm using artificial intelligence (AI) is trained to detect and identify the particles in the image. The information provided by this technology coupled with meteorological data provides farmers with a clear insight into the real risk of infection that their crops face allowing them to treat only when and possibly where necessary.
2 Measurement stations and qPCR
A total of 9 new-generation laser-based spore detectors have been placed in vineyards around Switzerland and France. 16 images are taken every day with a resolution of 0.8 µm/pixel. The solar-powered stations are autonomous as they are self-cleaning and automatically transmit the data to a centralised server.
2.1 Determination of the first infection
In the test field of the Agroscope, the National Centre of agricultural research of the Swiss Confederation, in Changins (Nyon, Switzerland), a station is placed every year with the purpose of measuring the disease dynamic when the vines are left untreated. The objective of the year 2021, a year particularly struck by downy mildew as seen in Fig. 1, was to determine the primary infection, which is theorised to originate from the soil. This is due to the occasional discrepancy between the primary infection predicted by models like Agrométéo/Vitimétéo-Plasmopara and calculations using the incubation period after the observation of the first symptoms in the field laboratory [10].
In 2021, the first oil spots of downy mildew in Changins were observed on the 25th of May (indicated in Fig. 1 with an arrow) which, considering the incubation period and a rain event with an intensity of 20.4 mm/h possibly causing splashing, suggests the first infection may have occurred around the 16th of May. This coincides with the PV spore measurements from the station depicted in the middle graph in Fig. 1, though some spores can already be seen the few days prior to the main rain event. On the other hand, the presence of EN spores was a lot less pronounced with only a few isolated sporulation events spread throughout the season. Another point to note is that the high frequency of measurements allows us to be sensitive to daily fluctuations and one-off events, for example caused by wind turbulences generated by machinery, which may be difficult to pinpoint when integrating the data over a longer period, e.g., a week.
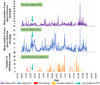 |
Figure 1 Measurements of the mean number of EN Spores (top) and PV spores (middle) between cleanings from the spore detection station. This is compared with the risk infection predictions (for first and secondary infections) given by the weather-based model Agrométéo for the year 2021. The arrow indicates the appearance of the first symptoms on the untreated plants. |
2.2 Validation with qPCR
SIGMA-2 passive samplers (Particle Vision GmbH) containing a sample holder with scotch tape were deployed during 2021 and 2022 in Changins (Nyon, Switzerland) in parallel to the spore detector. Correlations of spore concentrations from the detector and the passive spore trap are made using multiplex qPCR on DNA extracted from the tapes sampled once a week and shown in Fig. 2. A 4-plex qPCR was developed combining Plasmopara viticola f. sp. Aestivalis [11], Erysiphe necator, Botrytis cinerea and exogenous internal positive control primers and probes originally designed by methods described in reference [12]. The efficiency was validated (> 98%) [9].
In 2021, the presence of downy mildew was abundant with the primary infection occurring in the first half of May followed by multiple secondary infections, originating from the asexual cycle, through June and July. Detection of downy mildew spores quantified by qPCR only occurred by the end of June, illustrating that the passive sampling method was not sensitive enough to catch the beginning of the infection. Indeed, the spore detector is equipped with a fan that actively captures the particles at a fixed flow rate, rather than rely on the sedimentation of these within the sample holder. This also accounts for the large difference in maximum number of spore values. Furthermore, some holes in the qPCR data can be seen and are attributed to either an extraction issue or a damage of the scotch tape.
To improve the sampling technique and increase its sensitivity, the SporeStick rotating-arm samplers (OptiSense) with matches coated in petroleum jelly were installed in the field during 2022. However, the season was very dry with no downy mildew and only some powdery mildew at the end of the season. Quantification of powdery mildew during August and September show that EN is 400 times more likely to be trapped on rotating-arm sampler than on passive sampler, however no conclusion can yet be drawn from the results. This method will be further tested during the 2023 season with one SporeStick installed next to each of the three spore detection stations put in place in Changins.
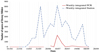 |
Figure 2 Comparison of the weekly-integrated number of spores of downy mildew between the spore detector (Station) and qPCR measurements from a scotch tape for the year 2021. |
3 Identification using artificial intelligence
The plethora of particles with sizes in the range of both PV and EN spores makes the identification of these equate to finding a needle in a haystack. However, using digital holography gives access to characteristics such as the shape and density of the particle as well as its size. To do so the interference pattern obtained and sent from the station to a centralised server undergoes a series of image processing techniques to better extract the embedded information [13]. The image is segmented into the various regions of interest that the algorithm has identified as a potential particle of interest. Using multiple decision criteria such as size, interference pattern, shape, and fringes a classification can be made. It quickly became apparent that there were some pollens and other interferants whose shape and size closely resemble that of the PV and EN spores making the process of precise classification more difficult. However, advancements in machine learning and neural networks can enable the automatization of the analysis whilst also distinguishing between these very similar particles
In this study we used the bag of features technique which can extract and represents any relevant or recurring features within a given image. The database consisted initially only of the classes of interest, namely PV and EN spores but individual classes for the main interferants were subsequently added to improve the distinction possibility. The total database amounts to over 30 000 images spread over the 8 classes, 80% of which was used to train the AI network and the remaining 20% for testing. Figure 3 shows the preliminary results of this algorithm, depicted as a confusion matrix, with a precision of 86.1%. It successfully distinguishes many of the pollens and spores from one another apart from a slight hesitation between Castanea Sativa pollens and PV as well as EN and Quercus Robur pollens, which could be the consequence of slightly less abundant ground truth databases. Furthermore, other techniques using neural networks with artificially augmented data are being evaluated as well as additional image processing techniques.
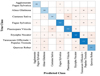 |
Figure 3 Confusion matrix for the large neural network, containing 8 classes, that uses the bag of features technique resulting in an 86.1% precision rate. |
4 Conclusion
Significant advancements have been made to tackle the issues regarding the sensitivity to various species of spores by introducing a laser-based, digital, holographic technique integrated into the existing stations. This technology was used to successfully determine the first infection confirmed by the observation of symptoms after the incubation period and, though the validation using a multiplex qPCR is still ongoing, the preliminary results are very promising. Additionally, planned field trials where successive decisions to treat or not according to the image analysis outputs will be evaluated, which in fine will enable the determination of quantitative spore thresholds to trigger the application of fungicides. Furthermore, the autonomous device allows for both highly resolved spatial and temporal data providing farmers with precise information regarding the situation in their fields when the spores are airborne and have not yet infected the crops. This, coupled with the current weather-based models such as Vitimétéo-Plasmopara that consider the life cycle of the plant, results in a powerful decision-making tool to target the treatments to reduce unnecessary pesticide use whilst optimising the prevention of the infection.
References
- M. Lechenet, F. Dessaint, G. Py, D. Makowski, N. Munier-Jolain, Nat. Plants 3, 6 (2017) [CrossRef] [Google Scholar]
- O. Viret, and K. Gindro. La Vigne. Maladies fongiques. Editions AMTRA, Nyon 1 (2014) [Google Scholar]
- C. Brischetto, et al. Frontiers in plant Sci., A weather-driven model for predicting infections of grapevines by sporangia of Plasmopara viticola 12 (2021) [Google Scholar]
- P.-H. Dubuis, O. Viret, B. Bloesch, A.-L. Fabre, A. Naef, G. Bleyer, H.-H. Kassemeyer, and R. Krause, Rev. Suisse Viticulture, Arboriculture, Horticulture. Lutte contre le mildiou de la vigne avec le modèle VitiMeteo-Plasmopara 44(3), 192–198 (2012) [Google Scholar]
- S.-E. Legler, T. Caffi, and V. Rossi. Plant Path. A model for the development of E rysiphe necator chasmothecia in vineyards 63(4), 911–921, (2014) [Google Scholar]
- T.C. Basso, M. Tran, V. Pini, S. Schnée, P.-H. Dubuis, J. Kasparian, and J.-P. Wolf. Rev. Suisse Viticulture, Aboriculture, Horticulture. Détection des spores de mildiou et d’oïdium en temps réel à haute résolution spatiale 52, 344-349, (2020) [Google Scholar]
- V. Kilin, V. Pini, J. Kasparian, S. Gros, and J-P. Wolf. BIO Web of Conferences. Real-time and spatially resolved assessment of pathogens in crops for site-specific pesticide reduction strategies 15, 01019. EDP Sciences (2019) [Google Scholar]
- S. Bellow, G. Latouche, S.C. Brown, A. Poutaraud, Z.G. Cerovic, J. Exp. Bot. 63, 3697 (2012) [Google Scholar]
- W. Yichen, and A. Ozcan. Methods. Lensless digital holographic microscopy and its applications in biomedicine and environmental monitoring 136, 4-16 (2018) [Google Scholar]
- P.-H. Dubuis, G. Bleyer, R. Krause, O. Viret, A.L. Fabre, M. Werder, A. Naef, M. Breuer, and K. Gindro. BIO Web of Conferences. VitiMeteo and Agrometeo: Two platforms for plant protection management based on an international collaboration 15, 01036 (EDP Sciences, 2019) [Google Scholar]
- O. Carisse, H. Van der Heyden, D.M. Tremblay, P.O. Hébert, and F. Delmotte. Plant Disease. Evidence for Differences in the Temporal Progress of Plasmopara viticola Clades riparia and aestivalis Airborne Inoculum Monitored in Vineyards in Eastern Canada Using a Specific Multiplex Quantitative PCR Assay 105(6), 1666–1676 (2021) [Google Scholar]
- O. Carisse, D.M. Tremblay, and A. Lefebvre, Plant Path. Comparison of Botrytis cinerea airborne inoculum progress curves from raspberry, strawberry and grape plantings 63(5), 983–993 (2014) [Google Scholar]
- S. Leoni, T. Basso, M. Tran, S. Schnée, A.-L. Fabre, J. Kasparian, J.-P. Wolf, and P.-H. Dubuis. BIO Web of Conferences. Highly sensitive spore detection to follow real-time epidemiology of downy and powdery mildew 50, 04003 (EDP Sciences, 2022) [Google Scholar]
All Figures
|
Figure 1 Measurements of the mean number of EN Spores (top) and PV spores (middle) between cleanings from the spore detection station. This is compared with the risk infection predictions (for first and secondary infections) given by the weather-based model Agrométéo for the year 2021. The arrow indicates the appearance of the first symptoms on the untreated plants. |
| In the text | |
|
Figure 2 Comparison of the weekly-integrated number of spores of downy mildew between the spore detector (Station) and qPCR measurements from a scotch tape for the year 2021. |
| In the text | |
|
Figure 3 Confusion matrix for the large neural network, containing 8 classes, that uses the bag of features technique resulting in an 86.1% precision rate. |
| In the text | |
Current usage metrics show cumulative count of Article Views (full-text article views including HTML views, PDF and ePub downloads, according to the available data) and Abstracts Views on Vision4Press platform.
Data correspond to usage on the plateform after 2015. The current usage metrics is available 48-96 hours after online publication and is updated daily on week days.
Initial download of the metrics may take a while.