| Issue |
BIO Web Conf.
Volume 68, 2023
44th World Congress of Vine and Wine
|
|
|---|---|---|
| Article Number | 01021 | |
| Number of page(s) | 3 | |
| Section | Viticulture | |
| DOI | https://doi.org/10.1051/bioconf/20236801021 | |
| Published online | 06 December 2023 | |
Using artificial intelligence (AI) for grapevine disease detection based on images
1 Televitis Research Group, University of La Rioja, 26006 Logroño, Spain
2 Institute of Grapevine and Wine Sciences (University of La Rioja, Consejo Superior de Investigaciones Científicas, Gobierno de La Rioja), 26007 Logroño, Spain
3 Department of Computer Science and Artificial Intelligence (DECSAI), Andalusian Research Institute in Data Science and Computational Intelligence (DaSCI), University of Granada (UGR), 18071 Granada, Spain
Abstract
Nowadays, diseases are one of the major threats to sustainable viticulture. Manual detection through visual surveys, usually done by agronomists, relies on symptom identification and requires an enormous amount of time. Detection in field conditions remains difficult due to the lack of infrastructure to perform detailed and rapid field scouting covering the whole vineyard. In general, symptoms of grapevine diseases can be seen as spots and patterns on leaves. In this sense, computer vision technologies and artificial intelligence (AI) provide an excellent alternative to improve the current disease detection and quantification techniques using images of leaves and canopy. These novel methods can minimize the time spent on symptom detection, which helps in the control and quantification of the disease severity. In this article, we present some results of deep learning-based approaches used for detecting automatically leaves with downy mildew symptoms from RGB images acquired under laboratory and field conditions. The results obtained so far with AI approaches for detecting leaves with downy mildew symptoms are promising, and they put in evidence of the huge potential of these techniques for practical applications in the context of modern and sustainable viticulture.
© The Authors, published by EDP Sciences, 2023
 This is an Open Access article distributed under the terms of the Creative Commons Attribution License 4.0, which permits unrestricted use, distribution, and reproduction in any medium, provided the original work is properly cited.
1 Introduction
From a general point of view, diseases are one of the major problems in crop production, the infections caused by certain pathogens can reduce productivity by 10% to 95% [1], resulting in a significant impact on the quantity and quality of agricultural products [2]. In viticulture, this effect is prominent, since commercial grapevine cultivars are susceptible to numerous pathogens, causing diseases that induce serious damage, reducing yield and grape quality [3]. Several leaf diseases such as black rot, black measles, powdery mildew, downy mildew, leaf blight, scab, and rust can be found on grape leaves of commercial vineyard blocks [4]. Therefore, nowadays, diseases are one of the major threats to sustainable viticulture.
As standard practice in viticulture, grapevine leaf diseases are controlled by fungicide treatments applied repetitively throughout the growing season. Therefore, timely monitoring of disease symptoms is essential to reduce disease spread and facilitate effective management practices. Reductions in frequency or areas of fungicide applications can have a relevant environmental and economic impact, which is desirable in modern viticulture.
The most common method for the detection and monitoring of leaf diseases in vineyards is the visual scouting done by an expert through the evaluation of visual symptoms in leaves or/and fruits. Manual detection through visual surveys, usually done by agronomists, relies on symptom identification and requires an enormous amount of time. Detection in field conditions remains difficult due to the lack of infrastructure to perform detailed and rapid field scouting covering the whole vineyard.
In general, symptoms of grapevine diseases can be seen as spots and patterns on leaves. In this sense, computer vision technologies and artificial intelligence (AI) provide an excellent alternative to improve the current disease detection and quantification techniques using images of leaves and canopy. AI is a field of computer science developed to create algorithms that mimic human intelligence to solve problems and automate decision-making [5]. When an AI algorithm is trained to detect disease symptoms of a particular pathogen, the intrinsic characteristics of the technique allow us to overcome the problems of the traditional image processing techniques providing more robust models.
In this article, we present some results of deep learning-based approaches used for detecting automatically downy mildew symptoms caused by Plasmopara viticola from RGB leaf images acquired under laboratory and field conditions.
2 Materials and methods
2.1 Experiment under laboratory conditions
The Televitis group of The University of La Rioja developed a new algorithm using a combination of computer vision techniques and fuzzy logic for the evaluation of the severity of downy mildew disease in grapevine leaves under laboratory conditions.
The process is summarised in Fig. 1. The first stage was the preparation of the plant material and the RGB image acquisition. The second stage was the use of computer vision techniques to find leaf discs in the image and highlight the disease severity on each leaf disc. Finally, the estimation of the downy mildew severity, obtained from the evaluation of the sporulation located in each image, was compared against scores obtained by a visual assessment performed by experts. A detailed description of the protocol and model is presented in Hernández et al. [6].
 |
Figure 1. Diagram of the methodology used to assess downy mildew severity on grapevine leaves under laboratory conditions. Adapted from Hernández et al. [6]. |
2.2 Experiment under in situ conditions
An algorithm using deep learning was implemented for detecting and localising automatically downy mildew symptoms in the grapevine canopy under field conditions.
The first step in the methodology was the acquisition of RGB images of the canopy of individual vines representing the complex conditions in the field. The RGB images used as inputs were acquired in several commercial vineyards located in northern Spain. The images were taken at different times of the day, with different sunlight conditions and both manually and using a phenotyping platform.
The second step was the preparation of the data for the modelling process where the images were labelled by an expert by separating the pixels representing the downy mildew symptoms from the rest of the image. Then, the images were divided into sub-images to consider the maximum detail of the small symptoms present on leaves.
Finally, a semantic image segmentation model (SegNet) proposed by Badrinarayanan et al. [7] was implemented and trained with the prepared data to automatically grapevine downy mildew spots in RGB canopy images. SegNet model was trained augmenting the training data with transformations such as horizontal flip and Contrast Limited Adaptive Histogram Equalization (CLAHE) equalisation. Computer vision techniques were applied to remove the false positive values of the output of the model, caused by very small spots detected by the algorithm. The symptoms detected by the model were assessed using a hold-out validation, comparing the image segmentation and the number of symptoms detected by the algorithm with the expert labelling.
3 Results and Discussion
3.1 Estimation under laboratory conditions
The developed algorithm for laboratory conditions provided information for each leaf disc in a Petri dish image (Fig. 2). The areas detected as sporulation were marked in blue (low-intensity sporulation) or in pink gradient (high-intensity sporulation) whereas, on each leaf disc, disease severity was expressed as a percentage of the disc covered by sporulation. When the evaluation of the discs calculated by the algorithm was compared with the evaluation provided by the experts a positive linear relationship was observed with a determination coefficient R2 of 0.88.
 |
Figure 2. (a) Example of the original Petri dishes images, and (b) downy mildew estimation in each grapevine leaf disc using the proposed method for laboratory conditions. |
3.2 Results for in situ conditions
The developed algorithm for field conditions provided information approximately for each plant (the whole area of the canopy contained in the scene). The model detected effectively almost all infected spots with a low rate of false positive values (Fig. 3). A slight overestimation of the prediction was observed, which could be due to the presence of symptoms similar to those of grapevine downy mildew from other diseases or damages in the leaves. Comparing the detection of the algorithm with the expert labelling, the segmentation achieved a mean Intersect of Union (IoU) of 0.67 and the symptom counting achieved an R2 of 0.92.
The precision of the proposed method was better in cases of lower disease severity, so this method could be a good approach for detecting the disease when the symptoms start to appear at the initial stages of infection. In practical terms, this characteristic is very important, since detection and treatment at the initial stage is a good practice to control and reduce the spread of the infection in a large area [8].
Numerous studies have been done using standard image processing to detect grapevine diseases by extracting relevant features of leaf images with symptoms. However, this conventional approach has problems achieving stable detection performance when there are changes in image acquisition conditions, for example, different illumination, and camera viewpoints [9]. Additionally, images captured under non-controlled conditions, e.g., canopy at field conditions, are too complex to be effectively processed with conventional approaches. In this sense, the results obtained in this study show the potential of AI to process complex scenes under changing conditions.
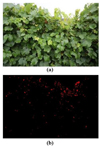 |
Figure 3. (a) Example of the original grapevine canopy image, and (b) detection of the downy mildew symptoms (in red) using the proposed method for field conditions. |
4 Conclusions
Both proposed methods (laboratory and field, conditions) could be applied to detect and localize downy mildew symptoms, and they show an adequate performance under the conditions in which they were developed. In the laboratory experiment, conditions were controlled, so standard computer vision techniques were sufficient to analyse the images and give an estimation of disease severity. On the other hand, images taken under field conditions require more complex methods, such as deep learning models, which combined with data augmentation techniques provided high throughput. Therefore, both methods seem promising to detect downy mildew symptoms or to adapt to other diseases in agriculture, under conditions similar to those of each experiment. In particular, the first approach would be used to analyse diseases in the laboratory, while the second would allow crop monitoring and decision-making in the field.
This study is part of the project NoPest (Novel Pesticides for a Sustainable Agriculture), which is funded by European Union Horizon 2020 FET Open program under Grant agreement ID 828940. Inés Hernández would like to acknowledge the research funding FPI grant 1150/2020 by Universidad de La Rioja and Gobierno de La Rioja. Dr Carlos Poblete-Echeverria would like to acknowledge the research program “Captación de talento internacional – Agricultura de precisión” funded by Comunidad Autonoma de La Rioja and Universidad de La Rioja
References
- J. Shirahatti, R. Patil, Akulwar, P. In Proceedings of the 2018 3rd International Conference on Communication and Electronics Systems (ICCES), Coimbatore, India, 15-16 October 2018, 1171–1174 (2018) [Google Scholar]
- D. Atkinson, Walker R.L. Crop protection and food quality: challenges and answers, The Science Beneath Organic Production 213–235 (2019) [CrossRef] [Google Scholar]
- W.F. Wilcox, W.D. Gubler, J.K. Uyemoto. Compendium of grape diseases, disorders, and pests. Am Phytopath Society (2015) [Google Scholar]
- P.B. Padol, A.A. Yadav. Advances in Signal Processing (CASP) 175–179 (2016) [Google Scholar]
- S.J. Russell, P. Norvig. Artificial Intelligence: A Modern Approach, 3rd ed.; Pearson: London, UK, (2009) [Google Scholar]
- I. Hernández, S. Gutiérrez, S. Ceballos, F. Palacios, S.L. Toffolatti, G. Maddalena, M.P. Diago, & J. Tardaguila. OENO One 56(3), (2022) [Google Scholar]
- V. Badrinarayanan, A. Kendall, R. Cipolla. IEEE Transactions on Pattern Analysis and Machine Intelligence 39(12), 2481–2495 (2017) [CrossRef] [PubMed] [Google Scholar]
- A. Adeel, M.A. Khan, M. Sharif, F. Azam, J.H. Shah, T. Umer, et al. Sustainable Comput. 24 (2019) [Google Scholar]
- Z. Zhang, Y. Qiao, Y. Guo, D. He. Deep Frontiers in Plant Science 13 (2022) [Google Scholar]
All Figures
|
Figure 1. Diagram of the methodology used to assess downy mildew severity on grapevine leaves under laboratory conditions. Adapted from Hernández et al. [6]. |
| In the text | |
|
Figure 2. (a) Example of the original Petri dishes images, and (b) downy mildew estimation in each grapevine leaf disc using the proposed method for laboratory conditions. |
| In the text | |
|
Figure 3. (a) Example of the original grapevine canopy image, and (b) detection of the downy mildew symptoms (in red) using the proposed method for field conditions. |
| In the text | |
Current usage metrics show cumulative count of Article Views (full-text article views including HTML views, PDF and ePub downloads, according to the available data) and Abstracts Views on Vision4Press platform.
Data correspond to usage on the plateform after 2015. The current usage metrics is available 48-96 hours after online publication and is updated daily on week days.
Initial download of the metrics may take a while.