| Issue |
BIO Web Conf.
Volume 68, 2023
44th World Congress of Vine and Wine
|
|
|---|---|---|
| Article Number | 01019 | |
| Number of page(s) | 8 | |
| Section | Viticulture | |
| DOI | https://doi.org/10.1051/bioconf/20236801019 | |
| Published online | 06 December 2023 | |
Viticulture under climate change: A case study on a water scarcity model
1 Associação para o Desenvolvimento da Viticultura Duriense (ADVID) - CoLAB VINES&WINES, Parque de Ciência e Tecnologia de Vila Real – Régia Douro Park, 5000-033 Vila Real, Portugal
2 University of Trás-os-Montes and Alto Douro, Quinta de Prados, Edf. ECT Polo I, 5000-801 Vila Real, Portugal
3 Research Centre in Digitalization and Intelligent Robotics (CeDRI), Instituto Politécnico de Bragança, Campus Sta Apolónia, 5300 Bragança, Portugal
Abstract
Changes in climatic patterns hinder the prediction of water availability, being imperative to develop new strategies to optimise water management in the agricultural sector. A multi-sensor network is being developed by ADVID/CoLAB VINES&WINES and University of Trás-os-Montes and Alto Douro (UTAD), aiming to determine water stress in vineyards, as a Decision Support System (DSS) for winegrowers. Remote wireless data transmission through LoRaWAN technology, will allow the development of a Machine Learning based model for water stress mapping. Measured parameters include soil, plant, and atmosphere data, given the importance of soil-plant-atmosphere continnum when evaluating water status. The pilot is installed in a commercial vineyard in the Douro Demarcated Region (DDR), and different sensor’s modules were distributed spatially in the parcel. Lower cost and higher range than WiFi or Bluetooth, LoRaWAN are especially important for applications in remote areas, where mobile networks have little coverage, allowing to benefit a larger number of producers. While overcoming the constraints of the current monitoring method (Scholander pressure bomb), this system will allow remote and continuous water monitoring, assisting the producer in decision making. Altogether, this solution will contribute to better management of water resources, as well to the sustainability and competitiveness of farms.
© The Authors, published by EDP Sciences, 2023
 This is an Open Access article distributed under the terms of the Creative Commons Attribution License 4.0, which permits unrestricted use, distribution, and reproduction in any medium, provided the original work is properly cited.
1 Introduction
Most of the world’s wine-producing regions experience seasonal drought. However, climate change, caused by the accumulation of gases that enhance the greenhouse effect, is currently a concern as weather patterns are more difficult to predict and natural resources such as water availability become uncertain [1]. Therefore, climate instability is a challenge to which the agricultural sector has and will have to adapt. Although grapes for wine production are grown under water deficits or with no irrigation, severe water stress can cause irreversible damage to the vine [2], compromising yield and grape quality. Thus, in the face of temperature increase and lower water availability, irrigation becomes an essential practice, especially in regions that depend on subsistence agriculture, as is the case of the Douro Demarcated Region (RDD). In this sense, monitoring of vine water status is extremely important, as it allows assertive water management in irrigated vines, thus contributing to optimising sustainable use of water resources.
1.1 Water management in the vineyard
Monitoring the water status of vines is accessed by crossing climatic data and measurements made by operators in the vineyard based on a method developed in 1965 by Schölander [3]. Nowadays, this method is still considered robust and reliable, being preferred by the viticultural sector for the assessment of the water status of the vine. However, this method requires the use of expensive equipment (pressure chamber and gas cylinder) and has difficult mobility [4], requiring specialised human resources, which makes it more expensive, thus inaccessible to smaller producers. In addition, it does not allow monitoring with a sufficient degree of detail for more continuous and efficient management of water in vineyards, due to the short window of opportunity for measurements, which does not allow extensive measurements to be carried out over large areas.
Water stress in plants results from the combination of soil, plant (water management capacity) and atmospheric conditions variables. Thus, it is of utmost importance to consider soil-plant-atmosphere continuum (SPAC) in the assessment of plant water status, considering that “water moves from the soil, through a plant, out into the surrounding atmosphere.” [5] or “water moving the ‘wrong way’ through the plant: from the atmosphere, through a plant, towards the soil” [6]. This is highlighted by García-Tejera et al. [7], who showed that evaporative demand, the hydraulic architecture of the plant, and the texture and depth of the soil play key roles in the final water potential observed. Garcia-Tejera group also states that establishing irrigation programs based on water potential, with no consideration of environmental and plant factors that influence it can create the paradox of having a plant suffering greater water stress even when high irrigation volumes are applied.
In regions where water availability is scarce and accessibility to the plots is difficult, water status assessment through the Scholander method is challenging. DDR is an example of the above mentioned conditions, a region of mountain viticulture with steep slopes (up to 70%) and the different ways of trellising the land (traditional vineyards, terraces and vineyards on high ground). In this context, it is imperative to find alternatives for monitoring the vineyard water status, as well as to create information, forecasting and warning systems for adaptation to natural risks, capable of supporting producers in making informed decisions.
1.2 Internet of Things in agriculture
Assessment of water status in vineyards is usually obtained through sensors placed in the soil (soil matrix potential), in the vine (stomatal conductance and leaf water potential) and data from meteorological stations [8].
Since in-field evaluation is often difficult, including laborious processes and several trips to the field, some authors propose the assessment of plant or soil water status from modelling using data from weather stations [9]. Others also measure sap flow through thermal dissipation (‘Granier’ method) as a complement to leaf water potential measurements and soil water content as indicators of water status [10].
The Internet of Things (IoT) is a rapidly evolving paradigm that integrates smart electronic devices (such as sensors and controllers) and computers throughout the internet to facilitate resource management during daily activities. IoT benefits several application domains such as connected industry, smart traffic, security and surveillance, healthcare and medicine, smart cities and homes, energy consumption, environment and pollution, etc. In the past decade, the use of IoT was also extended to agriculture, with the most research addressing monitoring, control, and some preliminary solutions in logistics and prediction [11].
However, most of the reported applications measures a single group of parameters (e.g., sensor-based irrigation systems, nutrient portion definition based on soil sensors, monitoring of various soil characteristics, automatic irrigation and water quality by moisture estimation based on acquired image processing) or were targeted to the implementation of smart greenhouses. Therefore, and considering the importance of SPAC when evaluating plants’ water status, to consider every component involved in water transport is essential.
When it comes to data storage, cloud storage has not been widely adopted, and communication technologies used were Wireless Personal Area Network (WPAN) protocols such as Bluetooth and ZigBee, followed by Wireless Metropolitan Area Networks (WMANs) supported by cellular technologies (GPRS/GSM/3G/4G) [11]. Recently, low-power WAN (LPWAN) technologies such as LoRa and NB-IoT are becoming commonplace in IoT applications due to their low power requirements, wide coverage range and low cost compared to other long-distance technologies. LoRa is the best option for smart agriculture applications, as an efficient solution for connecting smart devices. Main advantages include longer battery life and lower cost. On the other hand, licensed NB-IoT offers benefits in terms of Quality of Service (QoS), latency, reliability and range [12]. These technologies are appropriate for IoT applications that need to communicate tiny amounts of information over a long range.
Several studies have explored this new era of precision agriculture, such as the application of IoT technologies with the integration of unmanned aerial vehicles (UAVs) for sensing and automation of agricultural fields, namely irrigation, fertilisation, pesticide spraying, weed treatment, plant growth monitoring [13].
The main objective of this work is to develop and validate a continuous, remote and accessible method to monitor the vineyard’s water status, as well as contribute to the creation of a Decision Support System (DSS) to help producers manage and preserve water resources, thereby contributing to the resilience of companies.
2. Materials and methods
2.1 Sensor modules
Taking into account SPAC importance during water status monitoring, a system considering modules of soil, plant and atmosphere sensors was developed to measure several parameters (Table 1). Sensors were grouped considering energy consumption and the existence of a digital output by allowing more than one sensor to be connected to a module.
Soil, plant and atmosphere module sensors and parameters measured.
2.2 Data communication - LoRaWAN network
Requirements for IoT modules based on the LoRaWAN protocol include: low cost, low consumption, small dimensions, fast prototyping and easy programming (compatible with the Arduino environment). In view of these requirements, we chose the modular system from RAK Wireless (RAK) [14]. As the outputs required for connection to the chosen sensors (see Table 1) are SDI12, I2C and analogue, the modules for the RAK modular system were: the base module RAK5005-O (already supplied with connections for a 3.6 V lithium battery and solar charging - max 6 V); the core module RAK4631, based on Nordic nRF52840, with LoRa (SX1262) - the LoRaWAN protocol is implemented through a library; and the RAK5802 module, based on the 3PEAK TP8485E, which is designed to interface with the RS485 protocol. So that this last module could serve as an interface with the SDI-12 protocol, a dedicated library was developed.
2.3 Implemented system
The implemented system (Fig. 1) consists of sensor modules with wireless transmission using the LoRaWAN protocol (class A), transmitting data every 15 min, a gateway connected to The Things Network [15] through a GSM/LTE connection, and a server with a time-series database in InfluxDB [16] and Grafana [17] as an observability platform.
All “ATMOSPHERE” modules (6) have 2600 mAh lithium-ion batteries, and the “SOIL” (1) and “PLANT” (1) modules have batteries that provide a total of 4600 mAh of capacity, since each one has three sensors connected.
The entire system (gateway and modules) was placed in a commercial vineyard at Quinta dos Aciprestes (Real Companhia Velha, SA, Douro, Portugal) (Fig. 2) cultivated with cv “Touriga Franca”. The ‘ATMOSPHERE’ sensors were placed spatially distributed in the vineyard plot and included five modules with BME680 (01-05) and one module with the ATMOS41 All-in-One weather station. A module for the ‘PLANT’ sensor group with stem water potential sensor (FloraPulse), leaf wetness sensor and the infrared radiometer sensor was placed on a vine. Soil water content and soil water potential were also placed in soil next to a vine and were connected to the module for the ‘SOIL’ group. The plot had already installed a weather station (EMA) and a high precision soil moisture probe (EnviroSCAN) (Fig. 3).
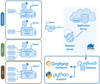 |
Figure 1 Graphical scheme of implemented system. |
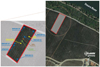 |
Figure 2 Location of the study field, delimited in red. Inset shows a zoom of the field of study, in which it is possible to see the location of the eight LoRaWAN modules. The gateway is situated about 300 m from the study field. Satellite imagery courtesy of Google Maps™. |
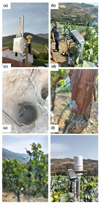 |
Figure 3 Placement of the (a) LoRaWAN gateway, (b) complete module, (c) “SOIL” group module, “PLANT” group (d) FloraPulse sensor inserted on a vine and (e) leaf wetness and temperature, and (f) ATMOS 41 “ATMOSPHERE” module, in loco, at Quinta dos Aciprestes. |
2.3 Data validation and model development
First, data collection aims at sensor validation. Collected data will be compared to assess the correlation between data acquired by the different sensors. Data collected by leaf water potential values, measured weekly by the Scholander method, weather station (EMA), and a high precision soil probe (EnviroSCAN) data, will be used as reference data. In this way, all SPAC components will be respected due to their importance in the assessment of plant water potential [7]. Also, previous works report a correlation between different variables measurable through the sensors, such as soil water content and sap flow, and leaf water potential [8,18,19].
Collected data will feed a database containing distinct information, it will be possible to evaluate SPAC information and to establish correlations. After sensor validation, and compilation of data collected over several years, development of an algorithm based on Machine Learning, will feed a water stress mapping model in the vineyard. Finally, after validation of this model, it is intended to create a Decision Support System (DSS), in an smartphone application format, to support technicians and producers to make informed decisions on water management.
3 Results
3.1 Module power consumption
The power consumption of the four types of modules (BME680, ATMOS41, “PLANT” and “SOIL”) was measured using a Nordic Semiconductor Power Profiler Kit II. Modules BME680, “PLANT” and “SOIL” consume battery for 7 seconds and are in sleep mode for 893 seconds, since transmission occurs every 15 minutes. This shows battery efficiency, and the low power consumption of these sensors, which are fed by solar energy. The ATMOS 41 module must always be powered to obtain wind gust and precipitation values, even though the microcontroller is in sleep mode.
3.2 Data collection and visualisation
The system was implemented on-site at Quinta dos Aciprestes, and data has been recorded in the database since July 2022 without losses. The presentation of data in the dashboard (Grafana) is divided into the groups previously described, i.e. ‘ATMOSPHERE’, ‘PLANT’ and ‘SOIL’. Figure 4 shows collected data in each module. For better visibility, only one week’s worth of data is presented: from August 8, 2022, until August 15, 2022.
Data from the “SOIL” group (Fig. 4A) includes soil water content and potential; “PLANT” group data (Fig. 4B and 4C) shows vine stem water potential, canopy temperature and leaf wetness; and finally, ATMOSPHERE” (Fig. 5), which includes air temperature and humidity, wind speed, gust and direction, barometric pressure, solar radiation, precipitation and lightning count; weather forecast data with daily forecasts for up to four days and hourly for up to 48 h for air temperature and humidity, wind speed and direction, and precipitation.
Visualisation of the data on the Grafana platform is shown, along with a module power consumption analysis (Fig. 5). Grafana platform was created for better visualisation and understanding of all the data being collected, allowing visualisation by day, week or month with a computer, tablet or smartphone.
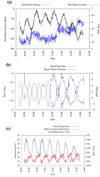 |
Figure 4 Data from (a) Soil moisture and water tension, (b) Stem water potential, and (c) Leaf wetness and canopy temperature. |
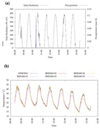 |
Figure 5 a) Data for solar radiation and precipitation, and b) Temperature data from ATMOS41 and BME680-01 to 05. |
3.3 Machine Learning water status mapping model
The data presented previously are indicative of the data present in the database. Through the time-series database, it is possible to work the data through scripts in Python. Collected data by the different sensors are validated through comparison with those from EMA, EnviroSCAN and weekly measurements of leaf water potential by the Scholander method. Collected data will enable establishing correlations between all measured parameters (plant, soil and atmosphere), since soil and atmosphere parameters influence plant water status. All data will feed a machine learning algorithm, to determine water stress in the plot. In future work, other factors will be determined. All system data will feed training data to a machine-learning system, using artificial intelligence to determine and predict, among other factors, water stress. In addition to the data collected by the system, weather forecast data obtained through the Pirate Weather API [20] was also added to the dashboard and uses, among other sources, data from the Global Forecast System (GFS) [21].
4 Discussion
A multi-sensor network is being developed to assess water stress in vineyards, as Decision Support System to winegrowers, in order to manage water stress and irrigation. This network aims at continuously monitoring soil, plant and weather parameters, in remote areas and in real time. The implemented system has been operating without communication losses. All eight modules have their batteries with voltage values higher than 4V, which demonstrates that the battery–solar panel set is well-dimensioned for all modules.
Regarding collected data, it should be noted that there is a difference between the temperature values of the ATMOS41 and the BME680 sensors. This may be due to the difference in shields, because in terms of accuracy, the two systems are nearly identical (±0.6 °C). However, the BME680 sensors use a 3D-printed PLA shield [22] (Fig. 6), for which studies indicate that the error in the measurement of air temperature is not greater than 1.5 °C [23]. As in the implemented system, the difference is greater when solar radiation is high (about 4°C) than when it is low (about 2 °C); more studies will have to be carried out to determine the origin of this difference. The remaining data is being recorded without losses, and data are within expected values.
Water movement through from soil to plant and to the atmosphere can be treated as a series of interrelated interdependent processes, therefore, understanding plant water relations is the prerequisite to irrigate in a sustainable manner, since plant growth is regulated by the balance of water supply and demand in the SPAC [24].
Leaf water potential is often used to determine plant water status. Predawn leaf water potential is used to estimate the capacity that plants have to recover water during nightime, when leaf stomata are closed, which is significantly related to soil water status in grapevines under various crop conditions [8, 25]. Williams and Araujo [26] concluded that other indicators: basal (predawn) and noon leaf water potential and stem water potential at noon could be equally viable methods to evaluate plant water status. All the abovementioned water status indicators combine the influence of environment (soil and atmosphere) and plant (internal hydraulic resistance) status.
Leaf water potential is often used to determine plant water status. When measured at predawn, when leaf stomata are closed, it is significantly related to soil water status in grapevines under various crop conditions [8,25]. Williams and Araujo [26] concluded that basal (predawn) and noon leaf water potential and stem water potential at noon could be equally viable methods.
Plant based indicators, like leaf or stem water potential, integrate the influence of both the plant (internal hydraulic resistances) and the environmental (soil and atmosphere) components.
Water deficit in soil reduces vegetative growth, stomatal conductance, photosynthesis, and yield [8]. Thus, soil water availability and vine water status need to be evaluated simultaneously to assess the overall water availability and to take action and prevent plants from achieving a severe water deficit through irrigation.
To develop a network respecting SPAC, we measured soil water content and water potential. Measuring an effective soil water potential is difficult because it varies throughout the day from the root and to the plant. Nevertheless, soil water content is a good tool to evaluate the plant water status [8] however, a large number of sensors must be installed to correctly monitor and to detect the spatial distribution of water. Furthermore, plant water status is determined by the balance between the water absorption by the roots, which is dependent on the characteristics of the root system and the distribution of water and its availability in soil, and water loss by transpiration, which depends on the atmospheric demand and the stomatal resistance as well as the hydraulic conductivity in the plant [27].
Regarding atmosphere parameters, the combined effect of soil water deficit and atmospheric evaporative demand should also be considered [26], which enables the evaluation of the plant water potential and transpiration losses [28].
The relation between water potential and Vapour Pressure Deficit (VPD) is not consensual, and requires several meteorological variables analysis. These facts reinforce the need to use different SPAC parameters to guarantee a robust and reliable model. Although some developed irrigation practices consider plant (evapotranspiration and canopy temperature) or plant and soil parameters in combination [29-31], the proposed system takes into consideration SPAC components.
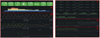 |
Figure 6 Images of the Grafana dashboard: (a) actual ATMOS41 values and a 7-day air temperature histogram; (b) atmospheric data; (c) weather forecast data; (d) plant data; and (e) soil data. |
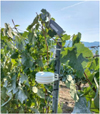 |
Figure 6 Example of the 3D-printed BME680 sensor shield. |
5 Conclusions and future work
Climate change and water scarcity demands the development of new strategies for water management. Being agriculture a sector that uses a high-volume of freshwater, there is the need to prevent the waste of water and, at the same time, optimise plant (vine) performance. Assessment of vines’ water status is essential to act in a timely and conscientious manner regarding irrigation, towards an efficient crop and water resources management.
This study contributes to a lower cost and more effective way of continuously monitoring The proposed multi-sensor approach for water status evaluation in vineyards, is cheaper and more effective than other approaches, since it considers the holistic assessment of soil, plant and atmosphere continuum parameters. Moreover, the developed system allows to monitor crop water status remotely and in real time, overcoming the challenges of the Schölander method. This is particularly important in regions where access to parcels and their management is difficult, such in DDR. The inclusion of a LoRaWAN module adds value to this solution due to its reduced costs and superior range compared to WiFi or Bluetooth being especially valuable for applications in remote areas where cellular networks have little coverage. Ultimately, this solution will not only provide guidance to producers to efficient water management of their vineyards, but also contribute to the environmental and economic sustainability.
The system was implemented in a Douro vineyard (Quinta dos Aciprestes) that shares the connection problems of remote areas. Through the implementation of a wireless transmission system based on LoRaWAN protocol (class A) and an online platform (Grafana) for data observation, the system has been operating without communication losses. Batteries present the correct voltage, demonstrating that the battery–solar panel set is well-dimensioned for all modules. Regarding collected data, it should be noted that there is a difference between the temperature values between the ‘ATMOSPHERE’ group sensors, and more studies will have to be carried out to determine the origin of this difference.
At this point, the proposed system is in concept validation step, as several years of data collection are needed for true and reliable correlations and conclusions. Data collected in 2023, will also allow us to have a general idea of the relationship between the different parameters, as well as to validate the data collected by the sensors, validating (or not) the use of the low-cost ones (SoilWatch10 and BME680). In future work, all data, together with on-site measurements using the Schölander camera and meteorological data, will eventually become training data to feed a machine learning system. This will allow more accurate estimation of the water stress of the vineyard and can be the base of an DSS. Future work perspective also includes the conjugation with other smart systems (harvest, irrigation, etc.) and the extension to other vegetal cultures.
References
- G.S. Malhi, M. Kaur, P. Kaushik, Sustain. 13, 1318 (2021) [CrossRef] [Google Scholar]
- J. Martínez-Lüscher, C.C.L. Chen, L. Brillante, S.K. Kurtural, Front. Plant Sci. 11 (2020) [Google Scholar]
- P.S. Scholander, E.D. Bradstreet, E.A. Hemmingsen, H.T. Hammel, Sci. 148, 339-346 (1965) [CrossRef] [PubMed] [Google Scholar]
- M. Kirkham, Principles of Soil and Plant Water Relations (Academic Press: Boston, 333-345, 2014) [CrossRef] [Google Scholar]
- P.S. Nobel, Physicochemical and Environmental Plant Physiology (Academic Press: Boston, 276-317, 2009) [CrossRef] [Google Scholar]
- C.B. Eller, A.L. Lima, R.S. Oliveira, New Phytol. 199, 151-162 (2013) [CrossRef] [PubMed] [Google Scholar]
- O. García-Tejera, Á. López-Bernal, F. Orgaz, L. Testi, F.J. Villalobos, Agric. Water Manag. 243, 106522 (2021) [CrossRef] [Google Scholar]
- A. Centeno, P. Baeza, J.R. Lissarrague, HortTechnology 20, 585-593 (2010) [CrossRef] [Google Scholar]
- R. Gaudin, K. Kansou, J.C. Payan, A. Pellegrino, C. Gary, OENO One 48, 1-9 (2014) [CrossRef] [Google Scholar]
- A.C. Malheiro, I.N. Gonçalves, A.A. Fernandes-Silva, J.C. Silvestre, N.S. Conceição, T.A. Paço, M.I. Ferreira, Acta Hortic. 922, 261-268 (2011) [CrossRef] [Google Scholar]
- J.M. Talavera, L.E. Tobón, J.A. Gómez, M.A. Culman, J.M. Aranda, D.T. Parra, L.A. Quiroz, A. Hoyos, L.E. Garreta, Comput Electron Agric. 142, 283-297 (2017) [CrossRef] [Google Scholar]
- R.S. Sinha, Y. Wei, S.H. Hwang, ICT Express 3, 14-21 (2017) [CrossRef] [Google Scholar]
- A.D. Boursianis, M.S. Papadopoulou, P. Diamantoulakis, A. Liopa-Tsakalidi, P. Barouchas, G. Salahas, G. Karagiannidis, S. Wan, S.K. Goudos, Internet Things 18, 100187 (2022) [CrossRef] [Google Scholar]
- The Official Website of RAKwireless—Where IoT Is Made Easy—RAKwireless-IoT Made Easy. Available online: https://www.rakwireless.com/en-us (accessed on 22 August 2022) [Google Scholar]
- The Things Network. Available online: https://www.thethingsnetwork.org/ (accessed on 22 August 2022) [Google Scholar]
- InfluxDB: Open Source Time Series Database|InfluxData. Available online: https://www.influxdata.com/ (accessed on 22 August 2022) [Google Scholar]
- Grafana: The Open Observability Platform|Grafana Labs. Available online: https://grafana.com/ (accessed on 22 August 2022) [Google Scholar]
- A. Valente, S. Soares, A. Malheiro, J. Santos, F.C. Pinto, S. Silva, M. Jerónimo, Available online https://hackathondouroporto2021-01.readthedocs.io/pt/latest/ (accessed on 22 August 2022) [Google Scholar]
- A.Z. Venturin, C.M. Guimarães, E.F. de Sousa, J.A.M. Filho, W.P. Rodrigues, I.A. Serrazine, R. Bressan-Smith, C.R. Marciano, E. Campostrini, Agric. Water Manag. 106343 (2020) [Google Scholar]
- PirateWeather Developer Portal. Available online: https://pirateweather.net/ (accessed on 22 August 2022) [Google Scholar]
- Global Forecast System (GFS). Available online: http://www.ncei.noaa.gov/products/weather-climate-models/global-forecast (accessed on 22 August 2022) [Google Scholar]
- Solar Radiation Shield for Weather Station|3D CAD Model Library|GrabCAD. Available online: https://grabcad.com/library/solar-radiation-shield-for-weather-station-1 (accessed on 19 August 2022) [Google Scholar]
- J.S. Botero-Valencia, M. Mejia-Herrera, J.M. Pearce, HardwareX 11, e00267 (2022) [CrossRef] [PubMed] [Google Scholar]
- J. Zhang, K. Guan, B. Peng, et al., Nat. Commun. 12, 5549 (2021) [CrossRef] [Google Scholar]
- A. Deloire, A. Carbonneau, H. Ojeda, Z. Wang, J. Intl. Sci. Vigne Vin 38, 1-13 (2004) [Google Scholar]
- L.E. Williams, F.J. Araujo, J. Am. Soc. Hortic. Sci. 127(3), 448–454 (2002) [CrossRef] [Google Scholar]
- P. Rodrigues, V. Pedroso, J.P. Gouveia, S. Martins, C. Lopes, I. Alves, Irrig. Sci. 30, 407-417 (2012) [CrossRef] [Google Scholar]
- S.A. Gavande, S.A. Taylor, Agron. J. 59, 1 (1967) [Google Scholar]
- S.A. O’Shaughnessy, M. Kim, M.A. Andrade, P.D. Colaizzi, S.R. Evett, Agric. Water Manag. 240, 106273 (2020) [CrossRef] [Google Scholar]
- R.J. Lascano, Agron. J. 92, 821-832 (2000) [CrossRef] [Google Scholar]
- S.A. O’Shaughnessy, S.R. Evett, P.D. Colaizzi, Agric. Water Manag. 159, 123-138 (2015) [CrossRef] [Google Scholar]
All Tables
All Figures
|
Figure 1 Graphical scheme of implemented system. |
| In the text | |
|
Figure 2 Location of the study field, delimited in red. Inset shows a zoom of the field of study, in which it is possible to see the location of the eight LoRaWAN modules. The gateway is situated about 300 m from the study field. Satellite imagery courtesy of Google Maps™. |
| In the text | |
|
Figure 3 Placement of the (a) LoRaWAN gateway, (b) complete module, (c) “SOIL” group module, “PLANT” group (d) FloraPulse sensor inserted on a vine and (e) leaf wetness and temperature, and (f) ATMOS 41 “ATMOSPHERE” module, in loco, at Quinta dos Aciprestes. |
| In the text | |
|
Figure 4 Data from (a) Soil moisture and water tension, (b) Stem water potential, and (c) Leaf wetness and canopy temperature. |
| In the text | |
|
Figure 5 a) Data for solar radiation and precipitation, and b) Temperature data from ATMOS41 and BME680-01 to 05. |
| In the text | |
|
Figure 6 Images of the Grafana dashboard: (a) actual ATMOS41 values and a 7-day air temperature histogram; (b) atmospheric data; (c) weather forecast data; (d) plant data; and (e) soil data. |
| In the text | |
|
Figure 6 Example of the 3D-printed BME680 sensor shield. |
| In the text | |
Current usage metrics show cumulative count of Article Views (full-text article views including HTML views, PDF and ePub downloads, according to the available data) and Abstracts Views on Vision4Press platform.
Data correspond to usage on the plateform after 2015. The current usage metrics is available 48-96 hours after online publication and is updated daily on week days.
Initial download of the metrics may take a while.