| Issue |
BIO Web Conf.
Volume 68, 2023
44th World Congress of Vine and Wine
|
|
|---|---|---|
| Article Number | 04013 | |
| Number of page(s) | 6 | |
| Section | Health | |
| DOI | https://doi.org/10.1051/bioconf/20236804013 | |
| Published online | 06 December 2023 | |
Antitumor effects of table grape extracts
1 CREA-VE, Research Centre for Viticulture and Enology, Council for Agricultural Research and Economics, Turi (BA) 70010, Italy
2 Laboratory of Nutritional Biochemistry, National Institute of Gastroenterology Saverio de Bellis, IRCCS Research Hospital, Castellana Grotte (BA) 70013, Italy
3 Ambulatory of Clinical Nutrition, National Institute of Gastroenterology Saverio de Bellis, IRCCS Research Hospital, Castellana Grotte (BA) 70013, Italy
4 Scientific Secretary of the Subcommittee Table Grapes, Raisins and Unfermented Grape Products- OIV, International Organization of Vine and Wine, Paris – Dijon, France
Abstract
Grape (Vitis vinifera L.) is a fruit rich in polyphenols, bioactive compounds able to prevent cancer, reduce tumorigenesis, and influence critical cancer-related pathways. This research shows the main results obtained in our previous works: 1) the characterization of the polyphenolic content and antioxidant activity of two table grape skin extracts (GSEs), Autumn Royal, and Egnatia; 2) the GSEs effects on Caco2 colon cancer cell; 3) the effects of GSEs on the lipid composition and the fluidity of the cell membrane. These in vitro studies suggested that Autumn Royal and Egnatia contain high levels of polyphenols, possess antiproliferative activity on the Caco2 human colon carcinoma cell line and inhibit cell migration by acting on membrane fatty acids composition. Moreover, these results highlighted that the new grape variety Egnatia is an exciting source of phenolic compounds that could interest the food and pharmaceutical industries.
© The Authors, published by EDP Sciences, 2023
 This is an Open Access article distributed under the terms of the Creative Commons Attribution License 4.0, which permits unrestricted use, distribution, and reproduction in any medium, provided the original work is properly cited.
1 Introduction
Grape (Vitis vinifera L.) is a fruit rich in polyphenols, bioactive compounds able to prevent cancer, reduce tumorigenesis, and influence critical cancer-related pathways. The anticancer effects of polyphenols are closely related to their chemical structure, concentration, and type of cancer [1,2]. Consequently, the phenolic composition of grapes, which is affected by the genotype, cultural practices, and environmental conditions [3], is crucial for determining health-promoting effects.
Attractive in vitro studies have been carried out on the anticancer properties of table grape extracts. Italia, Palieri and Red Globe, grape seed extracts, produce biological effects on Caco-2 cells, including growth inhibition, induction of markers of apoptotic signalling pathways, and programmed cell death. Interestingly, the highest inhibitory effect was recorded in the Palieri GSE-treated cells [4]. Moreover, apoptosis induced by Italia, Palieri and Red Globe grape seed extracts was considerably higher than that induced by epigallocatechin and procyanidins, alone or in association, suggesting a .sinergistic effect of the molecules in the extracts [5].
In this research, we show the main results obtained in our previous works: 1) the complete characterization of the polyphenolic content and antiproliferative activity of two table grape skin extracts (GSEs), Autumn Royal, a seedless black grape with beneficial properties, and Egnatia, a new red seedless genotype obtained by breeding programs carried out by Research Centre for Viticulture and Enology of the Council for Agricultural Research and Economics, Turi (BA), Italy [6].; 2) the GSEs effects on cell proliferation of human colon adenocarcinoma-derived Caco2 cell [7] ; 3) the effects of Autumn Royal and Egnatia GSEs on the lipid composition and the fluidity of the cell membranes [8].
These in vitro studies suggested a new antitumor mechanism of grape extracts involving membrane lipid composition. Moreover, these results highlighted that the new grape variety Egnatia is an exciting source of phenolic compounds that could interest the food and pharmaceutical industries.
2 Materials and methods
2.1 Preparation of grape skin extracts (GSEs)
Two table grapes were used: the black seedless variety Autumn Royal and the new red seedless variety Egnatia selected by the Research Centre for Viticulture and Enology of the Council for Agricultural Research and Economics breeding program, Turi (BA), Italy. The grapes used were produced in the Apulia region in the province of Bari in compliance with the regional regulations for integrated table grapes production. Grape samples were harvested at maturity, ensuring a representative vineyard sample. The skin from 50 berries, randomly collected, was manually separated from pulp and seeds, weighed and then dried at 37 °C, and ground with a blender until a fine powder. The samples (250 mg of dry weight) were resuspended with 5 ml of ethanol:water: hydrogen chloride 37% (70:30:1 v/v/v). After 24 h of complete darkness, the mixture was centrifuged. The supernatant was recovered, concentrated in a SpeedVac concentrator (Savant®SPD131DDA, Thermo Fisher Scientific, Waltham, MA, USA) for 90 min at 25 °C and 1.5 atmospheres of pressure and analyzed.
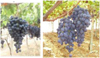 |
Figura 1 Autumn Royal and Egnatia grapes. |
2.2 Total polyphenolic content
Total phenolic content was determined by Folin–Ciocalteu micro scale protocol with slight modification, as previously described [9]. Briefly, 1 mL of water, 0.02 mL of extract sample, 0.2 mL of the Folin reagent, and 0.8 mL of 10% sodium carbonate solution were mixed and brought to 3 mL. The absorbance was measured at 765 nm after 90 min. Results were expressed as mg GAE/g dw using calibration curves with standard gallic acid.
2.3 UHPLC/QTOF mass spectrometry
The extracts were three-fold diluted with H2O/CH3CN 95:5 (v/v) and analyzed using an Ultra-High Performance Liquid Chromatography (UHPLC) Agilent 1290 Infinity coupled to Agilent 1290 Infinity Autosampler (G4226A) and Agilent 6540 accurate-mass Quadrupole-Time of Flight (Q-TOF) Mass Spectrometer (nominal resolution 40.000) with Dual Agilent Jet Stream Ionization source (Agilent Technologies, Santa Clara, CA, USA). For each sample, two analyses in both positive and negative ionization mode by recording data in full scan acquisition mode were performed. Chromatographic separation and QTOF conditions were previously described [6].
2.4 Antioxidant activity of GSEs
The antioxidant activity was evaluated by two single-electron-transfer assays (ABTS radical cation and DPPH assays) and one hydrogen-atom-transfer-based assay (ORAC). Calibration curves were prepared using Trolox, and results are expressed as µM Trolox equivalents/g of dry skin (µM TE/g of DW). The three tests were described in Milella et al. 2023 [10]. Briefly, in the DPPH (2,20-diphenyl-1-picrylhydrazyl) assay, The decrease in absorbance at 515 nm was measured after 30 min of incubation at 37 °C. In the ABTS (2,20-Azinobis-3-ethylbenzotiazoline-6-sulfonic acid) assay, absorbances were recorded after 20 min incubation at 30 °C. In the ORAC fluorimetric procedure, the fluorescence was measured every 2 min for 120 min at 37 °C with emission and excitation wavelengths of 530 and 485 nm, respectively. The final ORAC values were calculated using the area differences under the fluorescence decay curve (AUC) between the blank and the sample and expressed as micromole of Trolox equivalent per gram of dry weight of skin extract
2.5 Cell Lines and GSEs Treatment
The human colon adenocarcinoma-derived Caco2 cell line (well‐differentiated) (G1–2) was purchased from the American Type Culture Collection (ATCC) Cell Bank (Manassas, Virginia). Cells were grown in Roswell Park Memorial Institute (RPMI) 1640 medium for Caco2 cells and Dulbecco’s Modified Eagle Medium (DMEM) for SW480 cells, supplemented with 10% fetal bovine serum (FBS), 2 mM glutamine, 100 U/mL penicillin, and 100 μg/mL streptomycin, in monolayer cultures, and incubated at 37 °C in a humidified atmosphere containing 5% CO2 in air. The cells were allowed to grow for the established time and then harvested. After 24 hours, the cells were stimulated with the control of ethanol:water: hydrogen chloride 37% (70:30:1 v/v/v), or with Autumn Royal and Egnatia grape skin extracts at increasing concentrations and then incubated at 37 °C in an atmosphere of 5% CO2 in the air.
2.6 Assessment of cell proliferation
Cells have been cultured for 24 and 48 hours with increasing concentrations of Autumn Royal or Egnatia GSEs (10, 20, 50, and 80 μg/mL) dissolved in ethanol:water: hydrogen chloride 37% (70:30:1 v/v/v), and no treatment for the control group. The proliferative response was measured by colorimetric 3‐(4,5 di‐methylthiazol‐2‐yl). ‐2,5‐diphenyltetrazoliumbromide (MTT) assay (Sigma Aldrich; Milan, Italy), a validated test to assay cell proliferation in vitro [11].
2.7 Lipids extraction and PUFAs analysis
Lipids were extracted from cell pellets treated with increasing concentrations of Autumn Royal or Egnatia GSEs (20, 50, and 80 μg/mL). Untreated cells were used as control. The Folch extraction method was used with some modifications [12].
2.8 RNA extraction and quantitative real-time PCR
After 48 hours of treatment with Autumn Royal or Egnatia GSEs (20, 50, and 80 µg/mL), total RNA was extracted from Caco2 and SW480 cells using the Qiagen RNeasy Mini Kit (Qiagen, Hilden, Germany), according to the manufacturer’s instructions. According to the manufacturer's instructions, samples were retro‐transcribed and analyzed using real Time‐PCR to evaluate the enzyme Stearoyl‐ CoA desaturase‐1 (SCD1), expressions on a CFX96 Touch Real‐Time PCR Detection System (Bio‐Rad Laboratories, Milan, Italy). The gene-specific primer sets were used (Bio-Rad Laboratories); the β-actin gene was chosen as the reference gene. CFX Manager software 2.1 (Bio-Rad Laboratories) used the Ct method for relative quantification.
2.9 Migration assay
Caco2 colon cancer cell lines were trypsinized and seeded onto Oris 96 wells plates coated with collagen I (Platypus Technologies, Madison, WI, USA) at a density of 10 × 103 and 50 × 103 cells per well, respectively. Briefly, after 24 hours required for cellular adhesion, cells were treated with Autumn Royal and Egnatia GSEs (5, 10, 20, and 50 μg/mL). Cell migration was examined by using an inverted microscope connected to a CCD camera able to take photographs of each well after the removal of the stopper (T0) and after 24 hours (T1), 48 hours (T2), and 72 hours (T3) [8].
2.10 Statistical analysis
GSEs' total phenolic content (TPC) and polyphenolic profile (anthocyanins, flavonols, and flavanols) were analyzed by paired Student t‐test. For all other parameters investigated, one‐way analysis of variance (ANOVA) and Dunnett’s post‐test were used to evaluate the significance of the differences between the control and treated groups. Differences were considered statistically significant with a p‐value < 0.05. All data are expressed as mean ± Standard Deviation (SD). STATA statistical software, version 15.1 (StataCorp, 4905 Lakeway Drive, College Station, TX 77845, USA), was used.
3 Results and Discussion
3.1 Total polyphenolic content and antioxidant activity of autumn royal and Egnatia GSEs
The total content of polyphenols was determined in Autumn Royal and Egnatia GSEs, showing that Autumn Royal is richer in total polyphenols, expressed as milligrams of gallic acid equivalents per gram of dry weight of skin (GAE/g dw) than Egnatia (53.10 ± 1.99 mg GAE/g dw versus 37.45 ± 0.73 mg GAE/g dw, p-value < 0.05, respectively). Moreover, the polyphenolic composition was analyzed using Ultra-High-Performance Liquid Chromatography/Quadru pole-Time of Flight mass spectrometry (UHPLC/ QTOF). More than 100 compounds were identified in both GSEs, flavonoids such as anthocyanins, flavonols, flavanonols, flavan-3-ols, and proanthocyanidins; non-flavonoids such as phenolic acids and stilbenes.
The anthocyanin profiles of the two varieties were very similar, characterized by a higher percentage of anthocyanin-3-O-monoglucoside compounds (43% in both samples) (Fig. 2). These compounds possess potential antitumour effects based on a wide variety of biological activities, including antioxidant; anti-inflammation; anti-mutagenesis; induction of differentiation; anti-invasion; anti-metastasis [13].
Both samples showed flavonols and flavanonols as main signals, with the total signal intensity of 53% and 54% in Autumn Royal and Egnatia, respectively. In particular, high intensity of the B-ring trisubstituted flavonols, such as myricetin and syringetin glycosides, was found. Instead, signals of flavan-3-ols and proanthocyanidins were higher in Autumn Royal (23%) compared to Egnatia extract (6%). Several studies showed that flavan-3-ol oligomers (proanthocyanidins) are potent antioxidants and free radical scavengers characterized by anticancer properties [14]. Signals of total stilbene signals intensity were 2% in Autumn Royal and 5% in Egnatia extracts, while phenolic acids were relevant in both varieties (22% and 35% for Autumn Royal and Egnatia, respectively), (Fig. 3).
The antioxidant activity was determined using DPPH, ABTS, and ORAC tests and was significantly higher in Autumn Royal than in Egnatia (Table 1). The antioxidant activities of phenolic compounds greatly depend on their chemical structures [1,2].
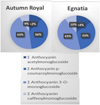 |
Figura 2 Anthocyanin compositions of Autumn royal and Egnatia GSEs expressed as the relative percentages (%) of the total M+· signals intensity in the positive-ion UHPLC/QTOF chromatogram. |
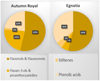 |
Figura 3 Classes of polyphenolic compounds identified in Autumn Royal and Egnatia GSEs and expressed as the relative percentage of the total [M-H]- signals intensity in the UHPLC/QTOF chromatogram. |
Antioxidant activity of Autumn Royal and Egnatia GSEs.
3.2 Effects of autumn royal and Egnatia grape skin extracts on cell growth
The effects of table grape polyphenols on cell proliferation have been evaluated by MTT assay (Fig. 4). Exposure of the Caco2 cell line to increasing concentration of Autumn Royal GSEs showed an antiproliferative action starting from a concentration of 50 μg/mL after 24 and 48 hours of treatment (Fig. 4a). Egnatia GSEs inhibited cell proliferation starting from 10 μg/mL, after 24 and 48 hours of treatment (Fig. 4b), and this effect was dose‐dependent.
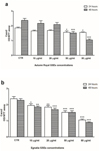 |
Figure 4 a) Effects on cell proliferation of Caco2 cell line treated with increasing concentrations of Autumn Royal GSEs (10, 20, 50, and 80 μg/mL) for 24 and 48 hours of incubation; (b) Effects on cell proliferation of Caco2 cell line treated with increasing concentrations of Egnatia GSEs (10, 20, 50, and 80 μg/mL), for 24 and 48 hours of incubation. All data are expressed as the mean ± Standard Deviation (SD) of three consecutive experiments. p‐value was determined by ANOVA with Dunnett’s post‐test. * p < 0.05, ** p < 0.03 and *** p < 0.01 versus control group (CTR). |
3.3 Membrane lipid profile after GSE Treatment in human colon cancer cell lines
Polyphenols can influence cell membrane fluidity and cell motility regulated by the enzyme Stearoyl‐ CoA desaturase‐1 (SCD1), which increases with the cancer aggressiveness. SCD1 is a key lipogenic enzyme that converts saturated fatty acids (SFAs), such as palmitic acid (C16:0) and stearic acid (C18:0), into monounsaturated fatty acids (MUFAs), such as palmitoleic acid (16:1n‐7) and oleic acid (C18:1n‐9). Elevated levels of SCD1 and, consequently, of MUFAs in the lipid bilayer membranes have been detected in several tumours, such as colorectal cancer (CRC). Several SCD1 inhibitors have been proposed as possible anticancer agents. To investigate the effects of Autumn Royal and Egnatia GSEs on the lipid composition and the fluidity of the cell membranes, fatty acids analysis was assessed. Compared to the control group in the Caco2 cells, the treatment with increasing concentrations of Autumn Royal and Egnatia GSEs caused an increase in saturated fatty acids (SFAs), starting from the concentration of 50 μg/mL for Autumn Royal and 20 μg/mL for Egnatia determining a drastic reduction in monounsaturated fatty acids (MUFAs) compared to the untreated control group.
To better investigate the ability of the two varieties of table grapes, Autumn Royal and Egnatia, to modulate the membrane fluidity, we studied the gene expression of SCD1. Compared to the control group, a significant down‐regulation of SCD1 was detected in Caco2 cells after treating 50 μg/mL of Autumn Royal and 80 μg/mL of Egnatia.
Since both Autumn Royal and Egnatia GSEs influence membrane fluidity and cell motility through the cytoskeleton rearrangement and changes in the membrane fatty acid profile, we investigated whether these extracts may have an additional effect on cell migration. The experiments showed that after 48 hours of incubation, there was a statistically significant reduction in migration percentage starting from the lowest concentration for both treatments in two cell lines (Fig. 6).
Mean percentage of main saturated and monounsaturated fatty acids in Caco2 membrane cell lines treated with increasing concentrations of Autumn royal and Egnatia GSEs (20, 50, and 80 μg/mL) for 48 hours.
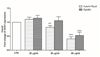 |
Figure 5 SCD1 gene expression levels detected in Caco2 cells treated with increasing concentrations of Autumn Royal and Egnatia GSEs (20, 50, 80 μg/mL) for 48 hours of incubation. All data are expressed as mean ± Standard Deviation (SD) of three consecutive experiments. p‐value was determined by ANOVA with Dunnett’s post‐test. * p < 0.05, ** p < 0.03 and *** p < 0.01 versus the control group (CTR). |
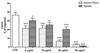 |
Figure 6 Inhibitory effect on migration of Caco2 cells treated with increasing concentrations of Autumn Royal and Egnatia GSEs (5, 10, 20, and 50 μg/mL) for 48 hours. All data are expressed as mean ± Standard Deviation (SD) of three consecutive experiments. p‐value was determined by ANOVA with Dunnett’s post‐test. * p < 0.05, ** p < 0.03 and *** p < 0.01 versus the control group (CTR). |
4 Conclusion
Autumn Royal and Egnatia contain high levels of polyphenols, especially anthocyanins, which can reduce cancer cell proliferation and inhibit tumour formation. In this work, we confirmed the antiproliferative activity of table grape polyphenols on the Caco2 human colon carcinoma cell line; we also assessed these natural compounds' ability to inhibit cell migration by acting on membrane fatty acids composition. The two table grape varieties can modify the fatty acid profile of cell membranes. Moreover, the treatment with both varieties of GSEs reduced the total levels of SCD1, a key lipogenic enzyme abundant in colorectal cancer. Our findings show that the new seedless red variety planted and grown in the Puglia region (Italy), is an exciting source of phenolic compounds that could interest the food and pharmaceutical industries.
References
- Araujo Vieira do Carmo, M., Girotto Pressete, C., Marques, M.J., Granato, D., and Azevedo, L. Curr. Opin. Food Sci. 24, 26–35 (2018) [CrossRef] [Google Scholar]
- Wang, T.Y., Li, Q., and Bi, K.S. Asian J. Pharm. Sci. 13(1), 12–23 (2018) [CrossRef] [Google Scholar]
- Xia, E.-Q., Deng, G.-F., Guo, Y.-J., and Li, H.-B. Int. J. Mol. Sci. 11, 622–646 (2010) [CrossRef] [Google Scholar]
- Dinicola, S., Cucina, A., Pasqualato, A., Proietti, S., D'Anselmi, F., Pasqua, G., Santamaria, A.R., Coluccia, P., Laganà, A., Antonacci, D., Giuliani, A., Bizzarri, M. Br. J. Nutr. 104(6), 824–832 (2010) [CrossRef] [PubMed] [Google Scholar]
- Dinicola, S., Cucina, A., Pasqualato, A., D'Anselmi, F., Proietti, S., Lisi, E., Pasqua, G., Antonacci, D., Bizzarri, M., Int. J. Mol. Sci. 13(1), 651–664 (2012) [CrossRef] [Google Scholar]
- Tutino, V., Gigante, I., Milella, R.A., De Nunzio, V., Flamini, R., De Rosso, M., et al. Molecules 25, 3352 (2020b) [CrossRef] [PubMed] [Google Scholar]
- Gigante, I., Milella, R.A., Tutino, V., DeBiase, G., Notarangelo, L., Giannandrea, M.A., et al.. Endocr Metab. Immune Disord. Drug Targets 20, 1740–1750 (2020) [CrossRef] [Google Scholar]
- Tutino, V., Gigante, I., Scavo, M.P., Refolo, M.G., De Nunzio, V., Milella, R.A., et al. Nutrients 12, 693 (2020) [CrossRef] [PubMed] [Google Scholar]
- Milella, R.A., Basile, T., Alba, V., Gasparro, M., Giannandrea, M.A., DeBiase, G., Genghi, R., Antonacci, D. J. Food Sci. Technol. 56, 4417–4428 (2019) [Google Scholar]
- Milella, R.A., De Rosso, M., Gasparro, M., Gigante, I., Debiase, G., Forleo, L.R., Marsico, A.D., Perniola, R., Tutino, V., Notarnicola, M., Velasco, R., Flamini, R. Front. Plant. Sci. 11(13), 1064023 (2023) [CrossRef] [Google Scholar]
- Tutino, V., Caruso, M.G., Messa, C., Perri, E.; Notarnicola, M. Anticancer Res. 32, 5371–5377 (2012) [Google Scholar]
- Folch, J., Lees, M., Stanley, G.H.S. J. Boil. Chem. 226, 497–509 (1957) [CrossRef] [Google Scholar]
- Lin, B.W., Gong, C.C., Song, H.F., Cui, Y.Y. Br. J. Pharmacol. 174(11), 1226–1243 (2017) [CrossRef] [PubMed] [Google Scholar]
- Unusan, N.. J. Funct. Foods 67, 103861 (2020) [CrossRef] [Google Scholar]
All Tables
Mean percentage of main saturated and monounsaturated fatty acids in Caco2 membrane cell lines treated with increasing concentrations of Autumn royal and Egnatia GSEs (20, 50, and 80 μg/mL) for 48 hours.
All Figures
|
Figura 1 Autumn Royal and Egnatia grapes. |
| In the text | |
|
Figura 2 Anthocyanin compositions of Autumn royal and Egnatia GSEs expressed as the relative percentages (%) of the total M+· signals intensity in the positive-ion UHPLC/QTOF chromatogram. |
| In the text | |
|
Figura 3 Classes of polyphenolic compounds identified in Autumn Royal and Egnatia GSEs and expressed as the relative percentage of the total [M-H]- signals intensity in the UHPLC/QTOF chromatogram. |
| In the text | |
|
Figure 4 a) Effects on cell proliferation of Caco2 cell line treated with increasing concentrations of Autumn Royal GSEs (10, 20, 50, and 80 μg/mL) for 24 and 48 hours of incubation; (b) Effects on cell proliferation of Caco2 cell line treated with increasing concentrations of Egnatia GSEs (10, 20, 50, and 80 μg/mL), for 24 and 48 hours of incubation. All data are expressed as the mean ± Standard Deviation (SD) of three consecutive experiments. p‐value was determined by ANOVA with Dunnett’s post‐test. * p < 0.05, ** p < 0.03 and *** p < 0.01 versus control group (CTR). |
| In the text | |
|
Figure 5 SCD1 gene expression levels detected in Caco2 cells treated with increasing concentrations of Autumn Royal and Egnatia GSEs (20, 50, 80 μg/mL) for 48 hours of incubation. All data are expressed as mean ± Standard Deviation (SD) of three consecutive experiments. p‐value was determined by ANOVA with Dunnett’s post‐test. * p < 0.05, ** p < 0.03 and *** p < 0.01 versus the control group (CTR). |
| In the text | |
|
Figure 6 Inhibitory effect on migration of Caco2 cells treated with increasing concentrations of Autumn Royal and Egnatia GSEs (5, 10, 20, and 50 μg/mL) for 48 hours. All data are expressed as mean ± Standard Deviation (SD) of three consecutive experiments. p‐value was determined by ANOVA with Dunnett’s post‐test. * p < 0.05, ** p < 0.03 and *** p < 0.01 versus the control group (CTR). |
| In the text | |
Current usage metrics show cumulative count of Article Views (full-text article views including HTML views, PDF and ePub downloads, according to the available data) and Abstracts Views on Vision4Press platform.
Data correspond to usage on the plateform after 2015. The current usage metrics is available 48-96 hours after online publication and is updated daily on week days.
Initial download of the metrics may take a while.