| Issue |
BIO Web Conf.
Volume 68, 2023
44th World Congress of Vine and Wine
|
|
|---|---|---|
| Article Number | 04020 | |
| Number of page(s) | 9 | |
| Section | Health | |
| DOI | https://doi.org/10.1051/bioconf/20236804020 | |
| Published online | 23 November 2023 | |
Ecological criteria for a sustainability assessment using the example of the online certification “Nachhaltig Austria” (Sustainable Austria)
1 Federal College and Research Institute for Viticulture and Pomology, Wiener Straße 74, A-3400 Klosterneuburg, Austria
2 Austrian Winegrowers' Association, Schauflergasse 6, A-1010 Wien, Austria
Abstract
The sustainability initiative must not focus on just a few and often ideologically occupied activities in wine production, but must bring about a transformation of all essential activities in the vineyard and cellar into more sustainable production. For this reason, the online tool “Sustainable Austria” has been introduced in Austria since 2015, which now covers around 25% of Austrian wine production and thus allows representative conclusions to be drawn about overall production. The data from 2019 to 2021 were used to evaluate part of the approximately 360 activities for assessing sustainability in vineyards and cellars.
In addition to the type of plant protection products, a targeted, efficient and economical plant protection application must be made, which can save up to 40% of plant protection products through the use of tunnel and recycling technology and low-loss spraying technology (application by 60% of winegrowing enterprises). While only 0.6% fungus-resistant grape varieties were planted in 2019, this figure was already 7% in 2021. While 30.5% of vineyards were treated with herbicides in 2019, the area fell to 11.8% in 2021. This trend is continuing and can in any case also be attributed to the advice and awareness-raising provided as part of the certification. Retreat areas for flora and fauna represent important biodiversity-promoting measures. More than 1/4 of the certified vineyards have a biodiversity area of over 10% of the vineyard area, more than half over 5% of the vineyard area. While wine producers prefer biennial and perennial greening at 51.3%, 74.4% of grape producers choose autumn/winter greening.
The wine industry's contributions to the achievement of the European Green Deal represent key environmental sustainability objectives. 11 wineries are already energy self-sufficient. The building rating A, A+, A++ and the earth cellar represent the best energy efficiency, which is achieved by more than 2/3 of the Austrian wineries. Furthermore, the share of renewable energy in the wine cellar has increased from 56.3% (2019) to 78.9% (2021). On the other hand, the use of new glass bottles is over 80%, while the refilling rate of glass bottles is only 6%. But the share of lightweight glass was 56.6% in 2021. If it is mentioned in this context that about 50% of the greenhouse gases can be attributed to the glass bottle and the refilling of glass bottles causes 59% less GHG than bag-in-box, a trend reversal for washing and filling used glass must be increased in the future. Cardboard packaging takes the lion's share with around 93%, whereby fortunately the share of packaging that has a recycling share of over 50% predominates with 68%.
About 1/4 of the vineyard areas are irrigated, whereby overcrown irrigation is of no importance and only water- saving drip irrigation is used. The average amount of irrigation is 41 mm. An economy-of-scale effect can be seen in the water consumption per litre of wine in the cellar. Water consumption in small businesses with less than 10,000 litres of wine production is around 15 litres, whereas it drops to around 3 litres in businesses with more than 500,000 litres of wine production. Wastewater management is very strictly regulated in Austria and requires additional measures and official obligations for wastewater treatments like neutralisation, sedimentation basins and complete wastewater treatment before discharge amount to about 57% in 2019.
The majority (about 2/3) of the grape harvest is harvested by hand. With about 1/3 fractionated harvesting, i.e. multiple selection of ripe and unripe grapes to increase quality, the ambitious quality production is underlined. The use of declarable quantities of allergenic protein-based wine treatment agents, sorbic acid, DMDC and/or lysozyme plays no role at all in Austria. While in 2020 and 2019 the natural or no tartar stabilisation was around 25%, this proportion increased to around 40% in 2021 due to the cold natural weather conditions. About half of the wines are stabilised by adding metatartaric acid, gum arabic, carboxymethyl cellulose or mannoproteins, while about 10 to 15% are stabilised by artificial cooling.
Finally, it is concluded that raising awareness about negative sustainability activities and providing information about alternatives has led to a positive sustainability development in the Austrian wine industry and continues to do so.
© The Authors, published by EDP Sciences, 2023
 This is an Open Access article distributed under the terms of the Creative Commons Attribution License 4.0, which permits unrestricted use, distribution, and reproduction in any medium, provided the original work is properly cited.
1 Introduction
The wine industry is a major contributor to environmental issues like climate change, wastage, natural resource depletion, and water and air pollution. These multiple impacts on the environment are primarily related to the use of fertilizers and plant protection products in vineyards, as well as bottling [1,2]. Beginning with the 2015 harvest, the Austrian Winegrowers' Association has provided an online certification tool to promote sustainability awareness in the areas of climate neutrality, energy use, material use, water use, soil fertility, biodiversity, high quality standards, social aspects and economic criteria in Austrian wine production. All activities in the vineyard and in the cellar are evaluated, from the new planting of vineyards to grape production and wine making, each given a score between +10 and -10. This gives each winery the opportunity to learn about sustainable strategies and to obtain the adequate certification by implementing numerous sustainability activities [3,4]. A transparency paper on the assessment of measures aims to give an overview of how the individual measures are evaluated in the nine areas of certification. It should be noted that for reasons of system security, this transparency paper does not list specific figures. Instead, six rating categories (excellent, very good, good, negative, very negative, extremely negative) have been established, which are then allocated to the different measures [5].
Only when the required limit is reached can a farm be sustainably certified. With the help of the online tool and the resulting sustainability report, the company is shown which activities it can improve and which are already working in an excellent sustainable manner.
As important information, it must be noted that after an ambitious limit value has been set, it is adjusted annually in the sustainability criteria, i.e. the worst wineries in the green area are moved to the yellow area and the red area is adjusted accordingly.
This scientific evaluation is intended to provide an in-depth sustainability analysis of Austrian management in vineyards and wineries, based on a verified set of data (Table 1; app. 25% of Austria's vineyard area was certified sustainable in 2022), which can be used for sustainable management decisions in an international context.
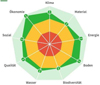 |
Figure 1 Evaluation Sustainable Austria according to the traffic light system as a spider diagram (Klima = climate change; Material = material consumption; Energie = energy use; Boden = soil fertility; Biodiversität = biodiversity; Wasser = water resource; Qualität = quality production; Sozial = social affairs; Ökonomie = economic effects). |
Development of certified wineries in the reporting period (*Winegrowers' cooperatives, for example, also appear as one “winery” in Table 1, with one of them comprising around 1000 winegrowers and two others comprising around 400 and 100 winegrowers. Instead of three wineries, 1500 producers could also appear. So- called “secondary enterprises” are also combined in one winery, which are outsourced to the owner's wife, son or father for tax reasons. Thus, far more than 2000 wineries are currently covered by the sustainability certification.).
2 Material and methods
For the data analysis, the audited data of the certification years 2019, 2020 and 2021 were used, analysed over time and evaluated with excel. The evaluation of the 2022 data is still ongoing, so it is not yet available. In some analyses, a differentiation is made between grape suppliers (production of grapes only) and winegrowing companies (production of grapes and wine); insofar as interesting differences exist between the often small- structured grape producers. This work focuses on the variety of activities in the vineyard and cellar and their ecological effects, which should show that the criteria of organic farming are by no means sufficient for an ecological assessment. The evaluations are presented in the sustainability categories biodiversity, climate change, material consumption, energy use, soil fertility and water resource as well as social and economic affairs. Of the approximately 360 activities in the sustainability tool, an allocation to one sustainability category, e.g. biodiversity, was made in the data analysis, although other positive or negative sustainability categories are also influenced to a lesser or equal extent.
The statements on the number of wineries must be seen in a relative light compared to the statistics in the agricultural sector. On the one hand, the grape suppliers to winegrowers' cooperatives are not surveyed separately, but the winegrowers' cooperative is shown as one company, although hundreds of producers are behind it. On the other hand, so-called secondary companies are not shown, which for tax reasons are registered in the name of the wife, mother, son, etc., but are basically integrated into the overall company. This results in larger wineries in the data analysis than appear in the agricultural statistics.
3 Results
Of the approximately 360 activities that were assessed with different weights in the nine sustainability criteria, only some are shown and assigned to only one sustainability criterion, although others also receive a similar positive or negative assessment in the sustainability tool. This is to prevent duplicate presentations. Information on this can be found in the transparency paper already cited.
3.1 Biodiversity
In many countries there is a countervailing discussion between organic and sustainable certified wineries. The positive development in the meantime shows that the Austrian sustainability certification is a reasonable and accepted supplement to organic production methods due to the diverse criteria.
The use of herbicides, in particular, is being discussed by the winegrowing enterprises in a controversial way. Glyphosate has already been banned since the 2018 harvest, but others are still tolerated. The negative assessment led to a percentage decrease in herbicide use despite ongoing accessions to sustainability certification. Without being able to present a scientific evaluation, we assume that a general ban would not have had this positive effect, but rather a hardening of the opposing positions.
While 30.5% of vineyards were treated with herbicides in 2019, the area fell to 11.8% in 2021. This trend is continuing and can in any case also be attributed to the advice and awareness-raising provided as part of the certification. It is interesting to note that wine producers have improved continuously from 32.6 to 12%, while grape producers have remained stable at around 10% despite numerous of new certifications.
The use of pheromone traps is widespread in Austria and the increasing abandonment of insecticides outside organic production has been well above 60% in recent years (64,8% in 2021).
The application rate of plant protection products depends essentially on the target-oriented application method. The less that is released into the environment through drift, the more environmentally friendly the effect, especially in terms of biodiversity and soil protection.
In recycling technology, three processes - the tunnel spraying process, the collector process and the reflector process - are currently used in practice, with the tunnel spraying technique being the most widespread. The application with the tunnel spraying unit is carried out with or without blower air flow. In the tunnel method, the spray tunnels surround the vines like tunnels and are sealed off from them with flexible plastic covers. The drops of pesticide that do not accumulate run off the tunnel walls into a collecting channel below. From there, they are pumped back into the pesticide tank via a filter system and thus returned to the equipment cycle. There are only minor differences between the recycling processes (tunnel spraying, collector and reflector processes) with regard to the recycling rate (recovery rate). The recycling rates depend on the respective vegetation stage and can, for example, be 50 to 70% in the pre-flowering stage of the vine, and still 15 to 30% in a fully developed canopy wall. Averaged over the entire vegetation period, a plant protection product savings potential of 30 to 40% is possible [6].
The low-loss spraying technology also prevents large parts of the drift. Both technologies are already used in about 60% of Austrian wineries, app. 30% by grape producers. The background to this is certainly the investment effort for new technologies, which are easier to finance for mostly larger wineries than for grape producers.
About 30% of the vineyards are protected against browsing by game. Mechanical measures (e.g. vine protection grids) play the most important role.
Unlike other agricultural products, viticulture has a high potential for biodiversity. On the one hand, slopes, margins, dry stone walls, etc. On the other hand, targeted greening measures in the vineyard row (see section on soil health) can introduce regional seeds as well as plants that support bees and butterflies.
More than 1/4 of the certified vineyards have a biodiversity area of over 10% of the vineyard area, more than half over 5% of the vineyard area.
More than 50% of the grape varieties planted are regionally established and typical DAC (Districtus Austriae Controllatus) varieties. The increase from 0.6% in 2019 to 7% in 2021 of fungus-resistant grape varieties reflects the environmentally conscious development in the Austrian wine industry.
After grubbing up vineyards, soil preparation for planting new vineyards is particularly important. For soil regeneration, perennial planting with special seeds is particularly important, which, however, also means a loss of yield for this period. 25% of wine producers, but only 11% of grape producers, do an intermediate greening with revegetation before planting (at least 2 years; at least 50% legumes). It should be mentioned that these data were only collected from those wineries that planted 183.23 ha of vines, i.e. only about 2% of the certified vineyard area.
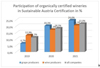 |
Figure 2 Percentage increase from organically certified wineries to Sustainable Austria. |
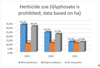 |
Figure 3 Development of herbicide use on sustainably certified wineries. |
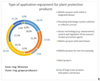 |
Figure 4 Type of application equipment for plant protection products. |
Protection against browsing by game in percent (hectare-related) of certified wineries and grape producers.
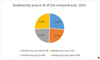 |
Figure 5 Biodiversity area in % of the vineyard area. |
3.2 Climate change
The building rating A, A+, A++ and the earth cellar represent the best energy efficiency, which is achieved by more than 2/3 of the wineries.
The proportion of metal poles among wine producers is over 95.7% and 3.6% wooden poles, while among grape producers the proportion of metal poles is 99%. Since the production of metal poles requires high energy and thus greenhouse gas expenditures, it must be mentioned that these poles have a lifespan of 30 years and far beyond. Wooden poles have a much shorter lifespan.
The glass bottle is responsible for around 50% of greenhouse gases in an average Austrian winery [4].
The share of new glass bottles is well over 80%, while the refilling of glass bottles is around 6% (Table 3). In the meantime, however, there is also a great awareness of the problem in the Austrian wine industry, which is why the share of light glass (<420g/0.75-l bottle) is 56.6%. The GHG emissions for washing (0.011 kg CO2 equivalent emissions per bottle) amount to only 3.4% measured against a new bottle in Austria. The bag‐in‐box system can only be used once. This system leads to 59% higher GHG emissions per liter (when considering refilling) compared to reusable bottles [7]. To improve the greenhouse gas balance, the refilling share must increase strongly.
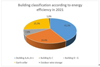 |
Figure 6 Building classification according to energy efficiency. |
Proportion of small sales units.
3.3 Energy use
Ambitious developments in regenerative energy production and use have been registered in the wine businesses in recent years. Particularly noteworthy are 11 wineries that are already energy self-sufficient.
Although there are vintage differences in the number of management measures, interestingly the expenditure remains constant on average, at around 185 litres of diesel per ha. Biodiesel does not seem to be an alternative so far.
The share of renewable energy in the wine cellar is a remarkable 79% and has increased last years (Fig. 7).
In the detailed representation, renewable energy sources contribute 59.9% and biomass 10%. It is interesting to note that the share of green electricity at 8% is just as high as that of conventional electricity (8.2%).
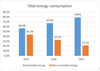 |
Figure 7 Total energy consumption of renewable and non- renewable energy in the wine cellar. |
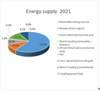 |
Figure 8 Energy supply 2021 for the wine production in the cellar. |
3.4 Material consumption
The share of screw caps has been very constant in recent years and is over 80% (83.8% in 2021). Natural cork consistently plays a minor role with about 7% and is mostly used for wines that can be stored for longer.
Cardboard packaging takes the lion's share with around 93%, whereby fortunately the share of packaging that has a recycling share of over 50% predominates with 68%.
Around 50% of the organic waste is placed directly in the vineyard and additionally 1/3 has been previously composted.
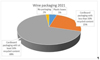 |
Figure 9 Wine packaging. |
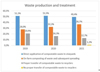 |
Figure 10 Waste production and treatment. |
3.5 Soil fertility
While wine producers prefer biennial and perennial greening at 51.3%, 74.4% of grape producers choose autumn/winter greening. One reason for this is certainly the reduction in volume due to greening measures in dry areas, which grape producers are often not fully compensated for.
In the comparison of the practices of fertilisation in the vineyard, wine producers predominantly use compost (40. 1%), whereas grape producers prefer manure (36%). Regional availability plays a decisive role here. It should be mentioned that fertiliser was only applied on 2003.5 ha (10.1% on areas of wine-producing farms and only 3.9% on areas of grape producers).
Frequent passes in the vineyard increase the risk of soil compaction. If an operation requires two passes through one row of a vineyard, this is two passes (foliage trimmer, stock clearer, ploughing …). On the other hand, two-row operations, e.g. plant protection with a double tunnel sprayer, count as 0.5 passes. The number of passes was surveyed in three categories (less than 15, 15-24 and 25 and more) and it can be that due to implement combinations and over-row implements, the number of passes up to 15 times is relatively low at around 57% of the wineries (42.7% passes 15-24 times in 2021).
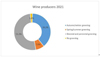 |
Figure 11 Greening strategies of wine producers in 2021. |
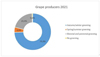 |
Figure 12 Greening strategies of grape producers in 2021. |
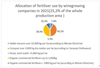 |
Figure 13 Allocation of fertiliser use by winegrowing companies. |
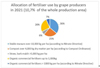 |
Figure 14 Allocation for fertiliser use by grape producers. |
3.6 Water resource
About 1/4 of the vineyard areas are irrigated, whereby overcrown irrigation is of no importance and only water-saving drip irrigation is used. The average amount of irrigation is 41 mm.
Wastewater management is very strictly regulated in Austria and requires additional measures for larger businesses before the water is allowed to flow into the public wastewater infrastructure. For this reason, over 100% of wastewater measures are reported. Official obligations for wastewater treatments like neutralisation, sedimentation basins and complete wastewater treatment before discharge amount to about 57% in 2019 (38.2% in 2021).
Water consumption in small businesses with less than 10,000 litres of wine production is around 15 litres, whereas it drops to around 3 litres in businesses with more than 500,000 litres of wine production (economy of scale).
Irrigation hectare-related in percent of the total vineyard area.
Waste water management.
Water consumption in litres per litre of wine.
3.7 Factors influencing quality
The majority (about 2/3) of the grape harvest is harvested by hand. With about 1/3 fractionated harvesting, i.e. multiple selection of ripe and unripe grapes to increase quality, the ambitious quality production is underlined.
The risk of hail damage is increasing in Austria due to climate change, which is why large and small- scale measures are being taken in vineyards.
Cross-flow filtration plays a significant role in Austria. For small businesses, on the other hand, layer filtration is the primary method, accounting for around 23.85% in 2021. About 48% of the wines are also filtered with diatomaceous earth in 2021. Flotation has gained in importance in recent years, accounting for about 1/3, and has become an important measure in must clarification. The use of fining agents to treat faults in wines played a role in the problematic year 2021, but is only used in around 15% of wines in normal years. The use of declarable quantities of allergenic protein-based wine treatment agents, sorbic acid, DMDC and/or lysozyme plays no role at all in Austria.
While in 2020 and 2019 the natural or no tartar stabilisation was around 25%, this proportion increased to around 40% in 2021 due to the cold natural weather conditions. About half of the wines are stabilised by adding metatartaric acid, gum arabic, carboxymethyl cellulose or mannoproteins, while about 10 to 15% are stabilised by artificial cooling.
Depending on the vintage, enrichment is applied, with 43.2% not enriched in 2021 (2020 46%, 2019 46.5%). Sucrose addition accounts for the majority (over 50%) and vacuum distillation plays a very minor role.
High-quality planting material plays an important role in ecological and long-lasting quality production.
The proportion of certified plant material is around 75%. Selected and in-house planting material with assessments accounts 10% each.
Method of harvesting.
Yield protection measures against hail damage.
Treatments in the wine cellar.
Tartrate stabilization.
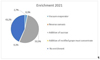 |
Figure 15 Quality management by enrichment in 2021. |
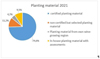 |
Figure 16 Planting material in 2021. |
3.8 Social affairs
The staffing situation on the labour market is leading to an increase in overpayment of the collectively agreed minimum wage and employment of older people over 55. One third of the companies purchase “clean” services by third parties who work fairly and sustainably. Unfortunately, the employment of disabled persons and the long-term unemployed is zero.
Excerpts from social activities.
3.9 Economic effects
An operational analysis with internationally customary key figures and past and future business developments is carried out by almost 100% of the wine producers. Only 15% of market participants have no contractual sales agreements. Inter-farm use of machinery to exploit fixed cost degression is used by 76.4% of the wineries. Almost 90% of businesses participate in regional events and activities, although in 2021 the Corona effect lowered the proportion. Corona also reduced farm-gate sales from well over 80% to 70% in 2021. For the recognition of the contribution for the common good, at least 20% of the funding income must be provided as voluntary services for trail construction, regional events, etc. must be demonstrably provided. Through Corona, the share has decreased from 2/3 to 1/3 of the wineries. More than 50% of the wineries integrate sustainability activities into the operational concept and the corporate mission statement. To cover risks, about 80% of the companies cover them with specific insurance policies.
Excerpts from economic activities.
4 Discussion and Conclusions
The interest in environmentally oriented wine production is very high in Austria and is reflected in the increasing numbers of organic (22% of the Austrian vineyard area) and sustainable cultivation (25% of the cultivated area), whereby the interest of organic farms in an additional sustainability certification is increasing. The background to this is a consciously forced transformation of many activities in the vineyard and cellar into a more sustainable production method. However, social problems that arose especially during the pandemic have also contributed significantly to this. Fair and “proper” employment of workers is at the centre of this.
Since legal regulation is being discussed but not yet foreseeable in Europe and beyond in the next few years, transparency of existing certifications is indispensable. Mandatory framework conditions could ensure this, so that in the competition for the best sustainability certifications, the environment, the employees in the wine industry and ultimately also the consumer benefit.
References
- G. Soja, E. Burger, V. Dockner, M. Gerzabek, S. Grünberger, K. Hackl, J. Haslinger, R. Hofmann, L. Kühnen, M. Mehofer, I. Omann, G. Rampazzo Todorovic, R. Rodriguez-Pascual, B. Schildberger, K. Vogl and F. Zehetner, 2019: Weinklim-1 - BML DaFNE (21.04.2023) [Google Scholar]
- P. Villanueva-Rey, I. Vázquez-Rowe, M. Moreira and G. Feijoo, Journal of Cleaner Production 65(2014), 330–341 [CrossRef] [Google Scholar]
- F.G. Rosner, W. Dobritzhofer, A. Geyrhofer, J. Glatt, S. Grossauer, S. Pöchtrager, F. Regner, N. Sauberer, H. Scheiblhofer, H. Sellner, G. Sojy, K. Vogl and F. Zehetner, Assessment of sustainability in Austrian wine production. 38th World Congress of Vine and Wine, 2015, 5–10 [Google Scholar]
- W. Poelz and F.G. Rosner, Mitteilungen Klosterneuburg 70(2020), 233–246 [Google Scholar]
- SustainableAustria: NachhaltigAustria- Tranzparenz papier_v6.indd (sustainableaustria.com) (21.04.2023) [Google Scholar]
- A.F. Geyrhofer, Recycling- und Sensortechnik - Applikationstechnik im Weinbau, Teil 2. Der Winzer 2008. Recycling- und Sensortechnik (der- winzer.at) 24.04.2022 [Google Scholar]
- W. Poelz and F.G. Rosner, Mitteilungen Klosterneuburg 73 (2023) (accepted, to be published) [Google Scholar]
All Tables
Development of certified wineries in the reporting period (*Winegrowers' cooperatives, for example, also appear as one “winery” in Table 1, with one of them comprising around 1000 winegrowers and two others comprising around 400 and 100 winegrowers. Instead of three wineries, 1500 producers could also appear. So- called “secondary enterprises” are also combined in one winery, which are outsourced to the owner's wife, son or father for tax reasons. Thus, far more than 2000 wineries are currently covered by the sustainability certification.).
Protection against browsing by game in percent (hectare-related) of certified wineries and grape producers.
All Figures
|
Figure 1 Evaluation Sustainable Austria according to the traffic light system as a spider diagram (Klima = climate change; Material = material consumption; Energie = energy use; Boden = soil fertility; Biodiversität = biodiversity; Wasser = water resource; Qualität = quality production; Sozial = social affairs; Ökonomie = economic effects). |
| In the text | |
|
Figure 2 Percentage increase from organically certified wineries to Sustainable Austria. |
| In the text | |
|
Figure 3 Development of herbicide use on sustainably certified wineries. |
| In the text | |
|
Figure 4 Type of application equipment for plant protection products. |
| In the text | |
|
Figure 5 Biodiversity area in % of the vineyard area. |
| In the text | |
|
Figure 6 Building classification according to energy efficiency. |
| In the text | |
|
Figure 7 Total energy consumption of renewable and non- renewable energy in the wine cellar. |
| In the text | |
|
Figure 8 Energy supply 2021 for the wine production in the cellar. |
| In the text | |
|
Figure 9 Wine packaging. |
| In the text | |
|
Figure 10 Waste production and treatment. |
| In the text | |
|
Figure 11 Greening strategies of wine producers in 2021. |
| In the text | |
|
Figure 12 Greening strategies of grape producers in 2021. |
| In the text | |
|
Figure 13 Allocation of fertiliser use by winegrowing companies. |
| In the text | |
|
Figure 14 Allocation for fertiliser use by grape producers. |
| In the text | |
|
Figure 15 Quality management by enrichment in 2021. |
| In the text | |
|
Figure 16 Planting material in 2021. |
| In the text | |
Current usage metrics show cumulative count of Article Views (full-text article views including HTML views, PDF and ePub downloads, according to the available data) and Abstracts Views on Vision4Press platform.
Data correspond to usage on the plateform after 2015. The current usage metrics is available 48-96 hours after online publication and is updated daily on week days.
Initial download of the metrics may take a while.